Production and business indicators
| NO. | INDICATORS | UNIT | IMPLEMENTED 2023 | 2024 | PERCENTAGE | ||
|---|---|---|---|---|---|---|---|
| PLANNED | IMPLEMENTED | COMPARISON (%) | |||||
| A | B | C | 1 | 2 | 3 | 3/2 | 3/1 |
| Output | |||||||
| 1 | Production | ||||||
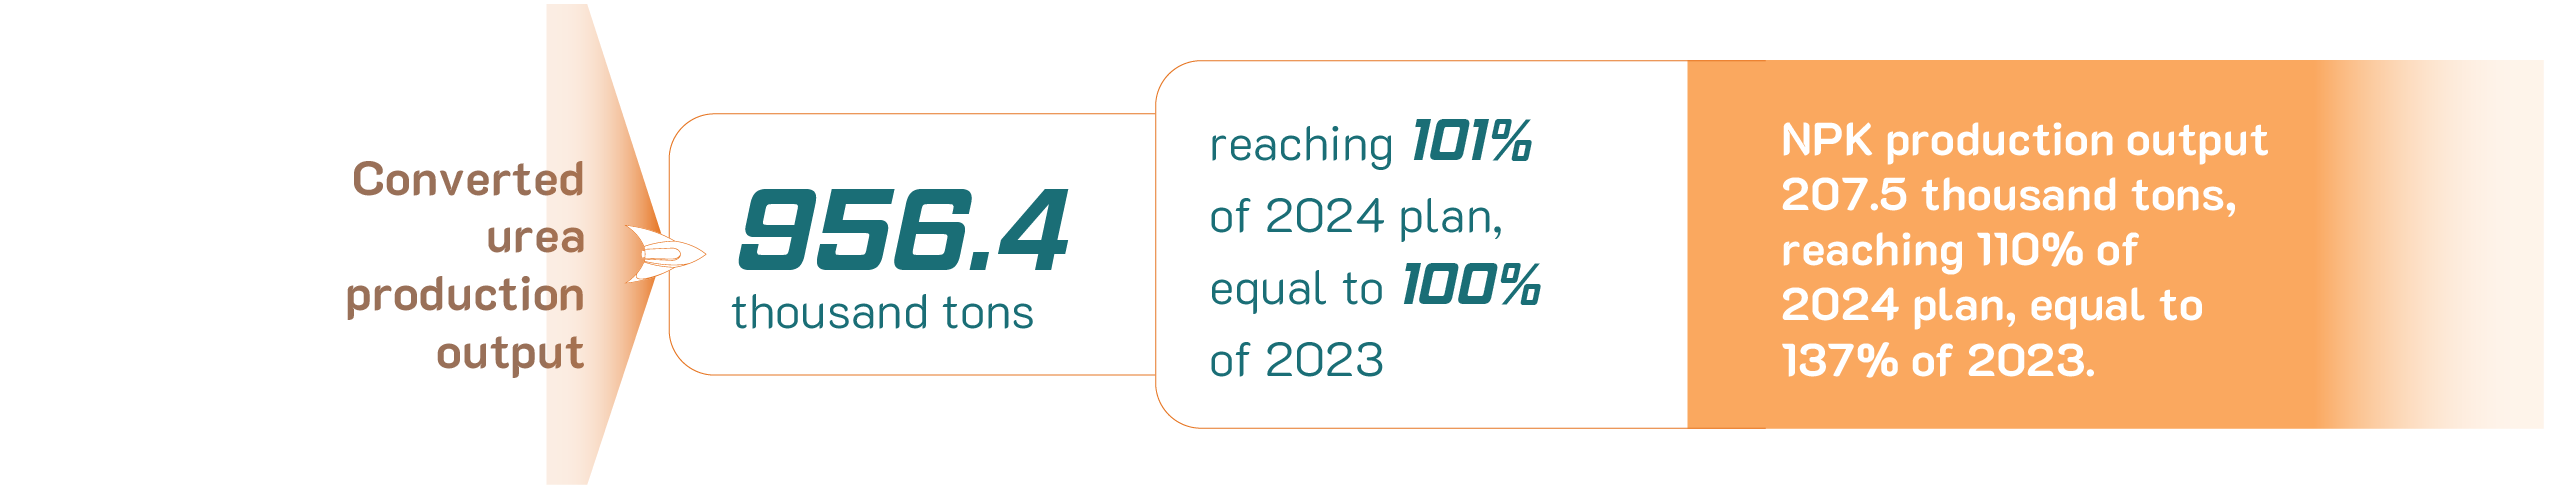
| 1.1 | Converted urea | thousand tons | 955.6 | 947.0 | 956.4 | 101% | 100% |
| In which: - Functional urea |
thousand tons | 69.6 | 102.0 | 106.6 | 105% | 153% | |
| 1.2 | NPK | thousand tons | 151.1 | 188.0 | 207.5 | 110% | 137% |
| 2 | Consumption | ||||||
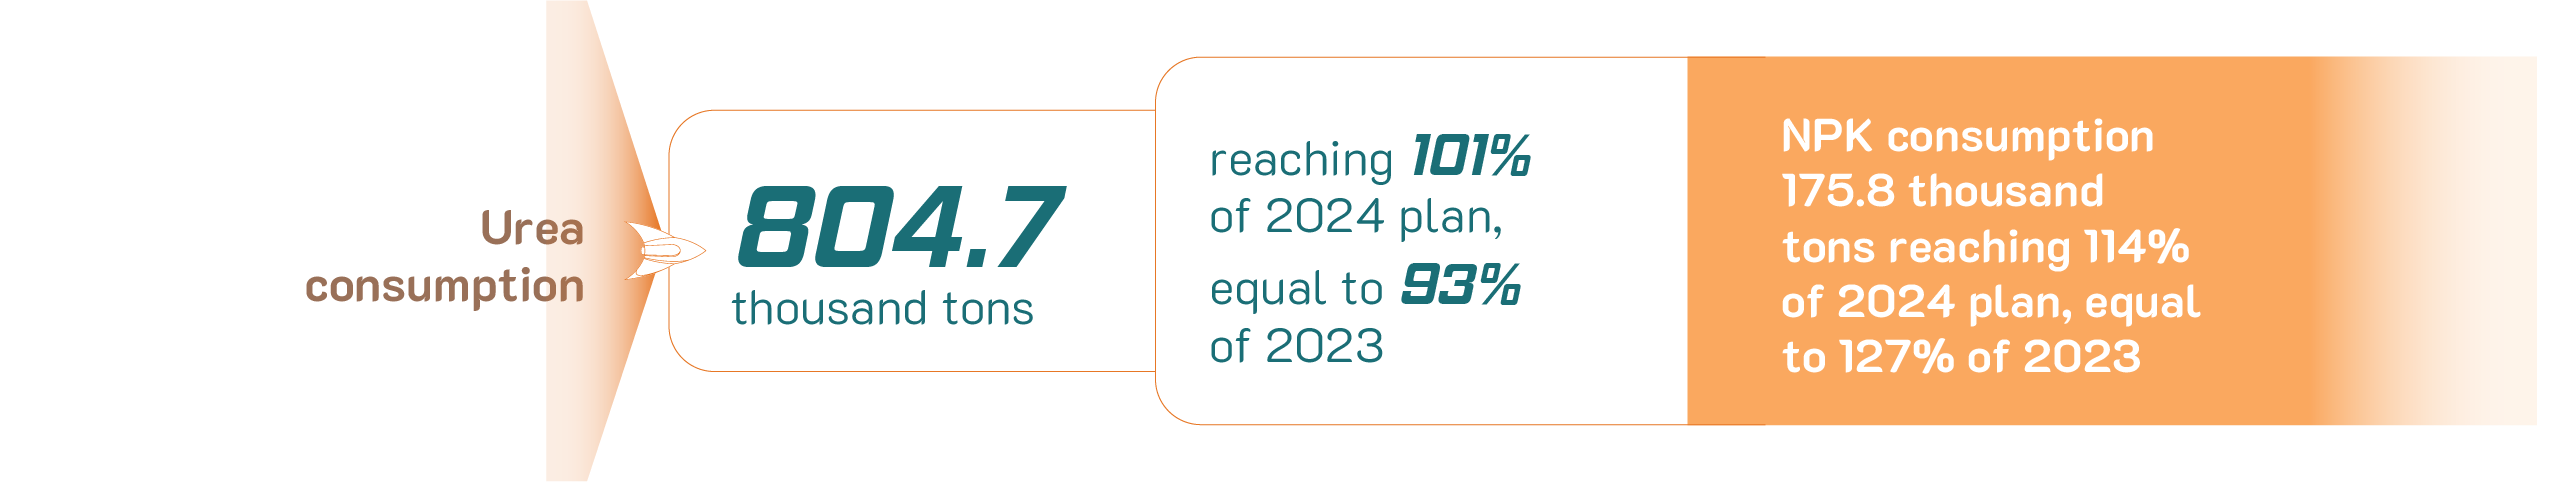
| 2.1 | Urea | thousand tons | 866.0 | 800.0 | 804.7 | 101% | 93% |
| 2.2 | Functional urea | thousand tons | 72.5 | 88.0 | 90.4 | 103% | 125% |
| 2.3 | NPK | thousand tons | 138.6 | 154.0 | 175.8 | 114% | 127% |
| 2.4 | Self-trade fertilizers | thousand tons | 183.2 | 248.0 | 254.4 | 103% | 139% |
| Consolidated financial indicators | |||||||
| 1 | Total revenue | billion VND | 13,172.4 | 13,605.0 | 14,037.3 | 103% | 107% |
| 2 | Profit before tax | billion VND | 1,254.8 | 1,222.0 | 1,522.1 | 125% | 121% |
| 3 | Profit after tax | billion VND | 1,110.1 | 1,144.0 | 1,428.0 | 125% | 129% |
| 4 | Obligations to State budget | billion VND | 426.81 | 295.41 | 370.97 | 126% | 87% |
| Parent company’s financial indicators | |||||||
| 1 | Total revenue | billion VND | 13,048.4 | 12,882.0 | 13,252.4 | 103% | 102% |
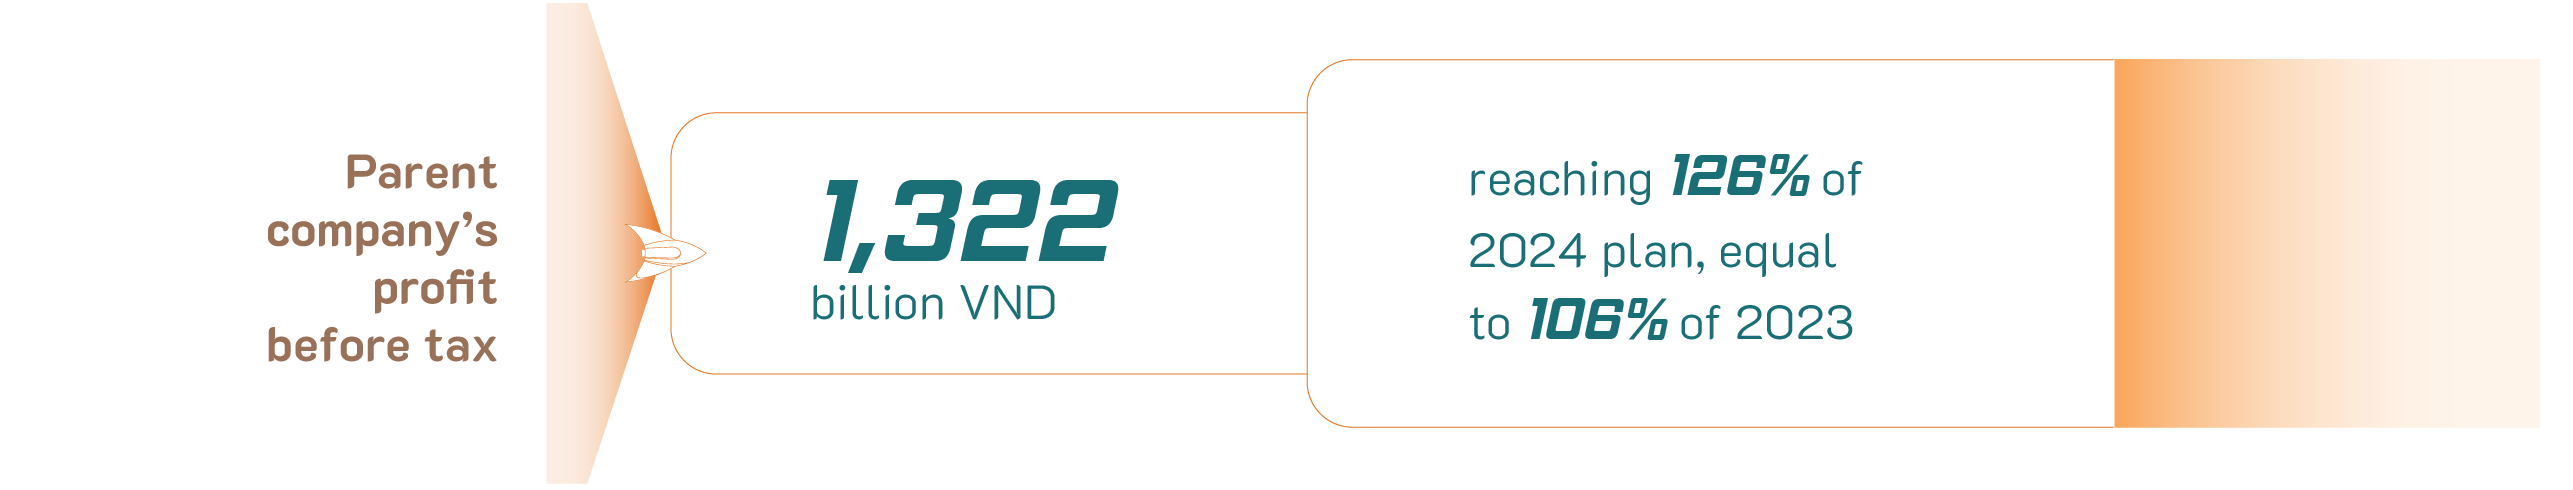
| 2 | Profit before tax | billion VND | 1,252.2 | 1,052.0 | 1,321.7 | 126% | 106% |
| 3 | Profit after tax | billion VND | 1,108.6 | 975,0 | 1,233.7 | 127% | 111% |
| 4 | Obligations to State budget | billion VND | 419.88 | 283.69 | 366.13 | 129% | 87% |
| 5 | Equity at the end of the period | billion VND | 9,925.7 | 9,850.2 | 9,949.5 | 101% | 100% |
| 6 | Return On Equity (ROE) | % | 11% | 10% | 12% | 125% | 111% |
| Investment in basic construction and acquisition of machinery and equipment | |||||||
| 1 | Investment value | billion VND | 404.7 | 1,202.9 | 1,173.2 | 98% | 290% |
| 2 | Investment capital | billion VND | 404.7 | 1,202.9 | 1,173.2 | 98% | 290% |
| 2.1 | Owner’s equity | billion VND | 403.7 | 750.6 | 795.4 | 106% | 197% |
| 2.2 | Other capital | billion VND | 1.0 | 452.3 | 377.8 | 84% | 37,780% |
Assessment on
PERFORMANCE OF PARENT COMPANY


PVCFC has completed all key targets for 2024 as set forth by the GMS.
PERFORMANCE OF SUBSIDIARY – PETROLEUM PACKAGING JOINT STOCK COMPANY (PPC)
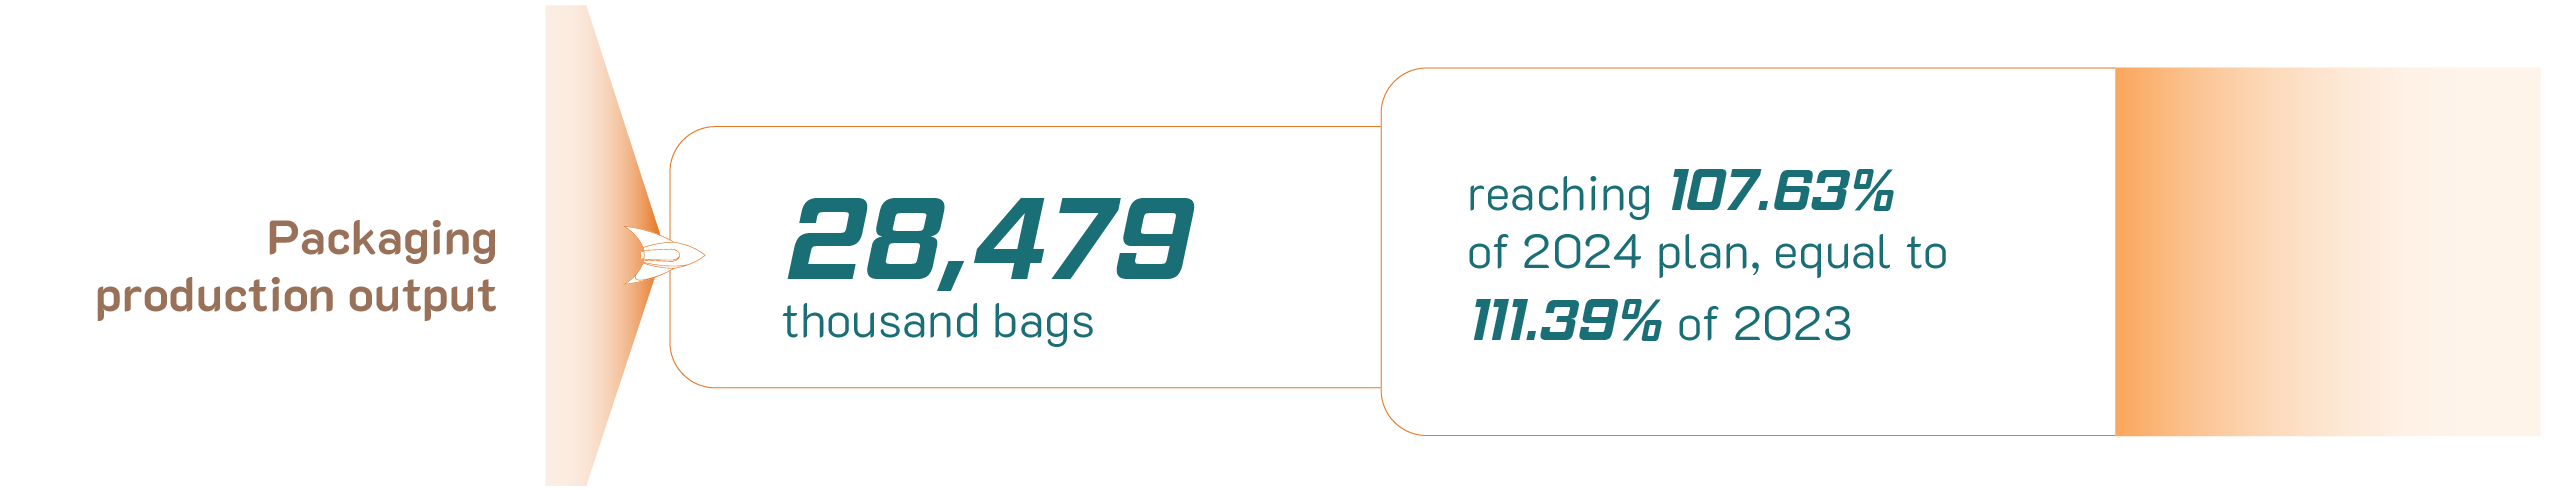
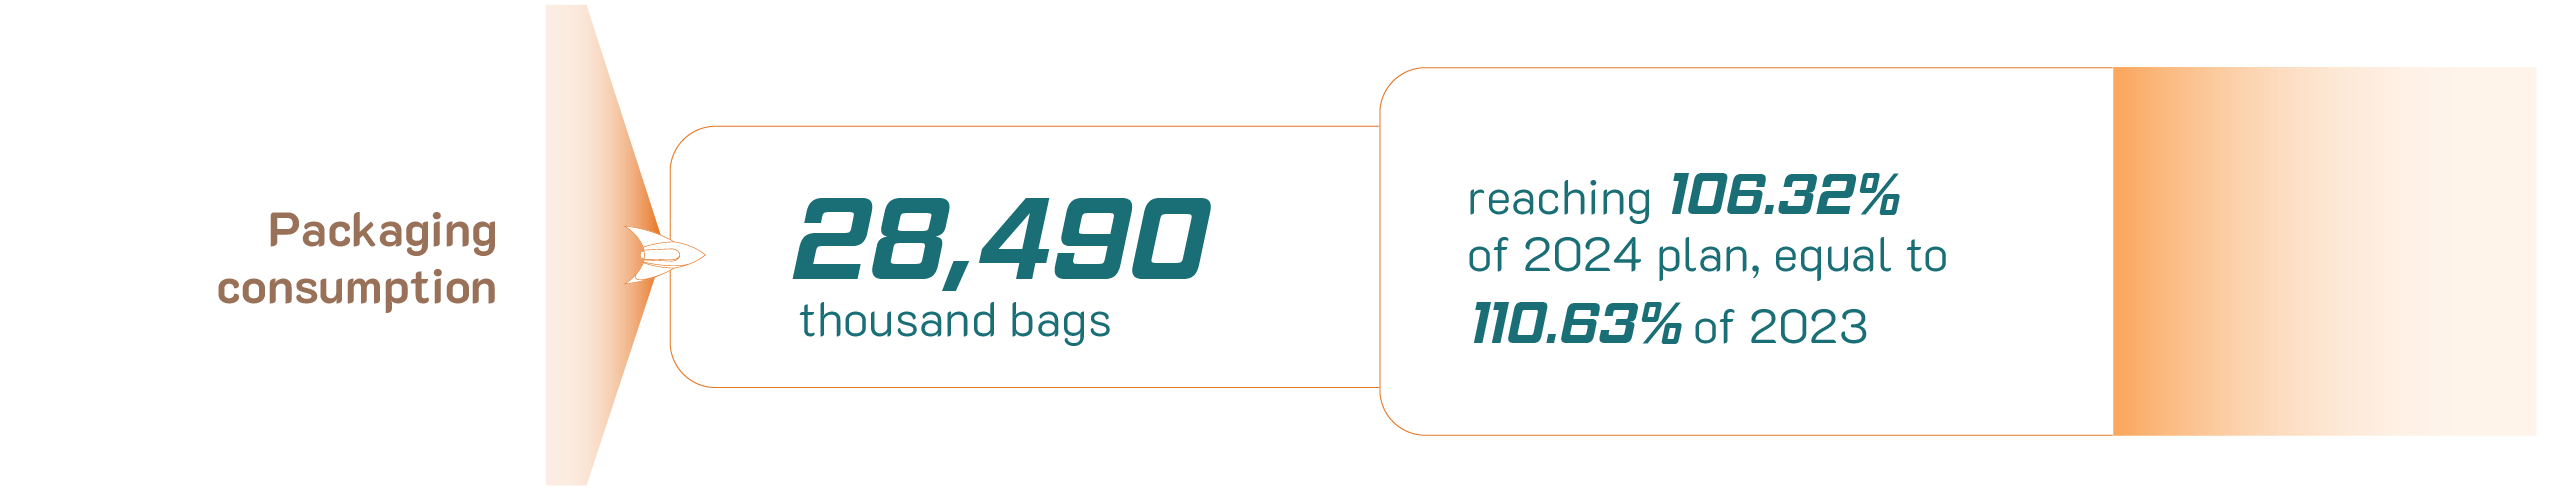
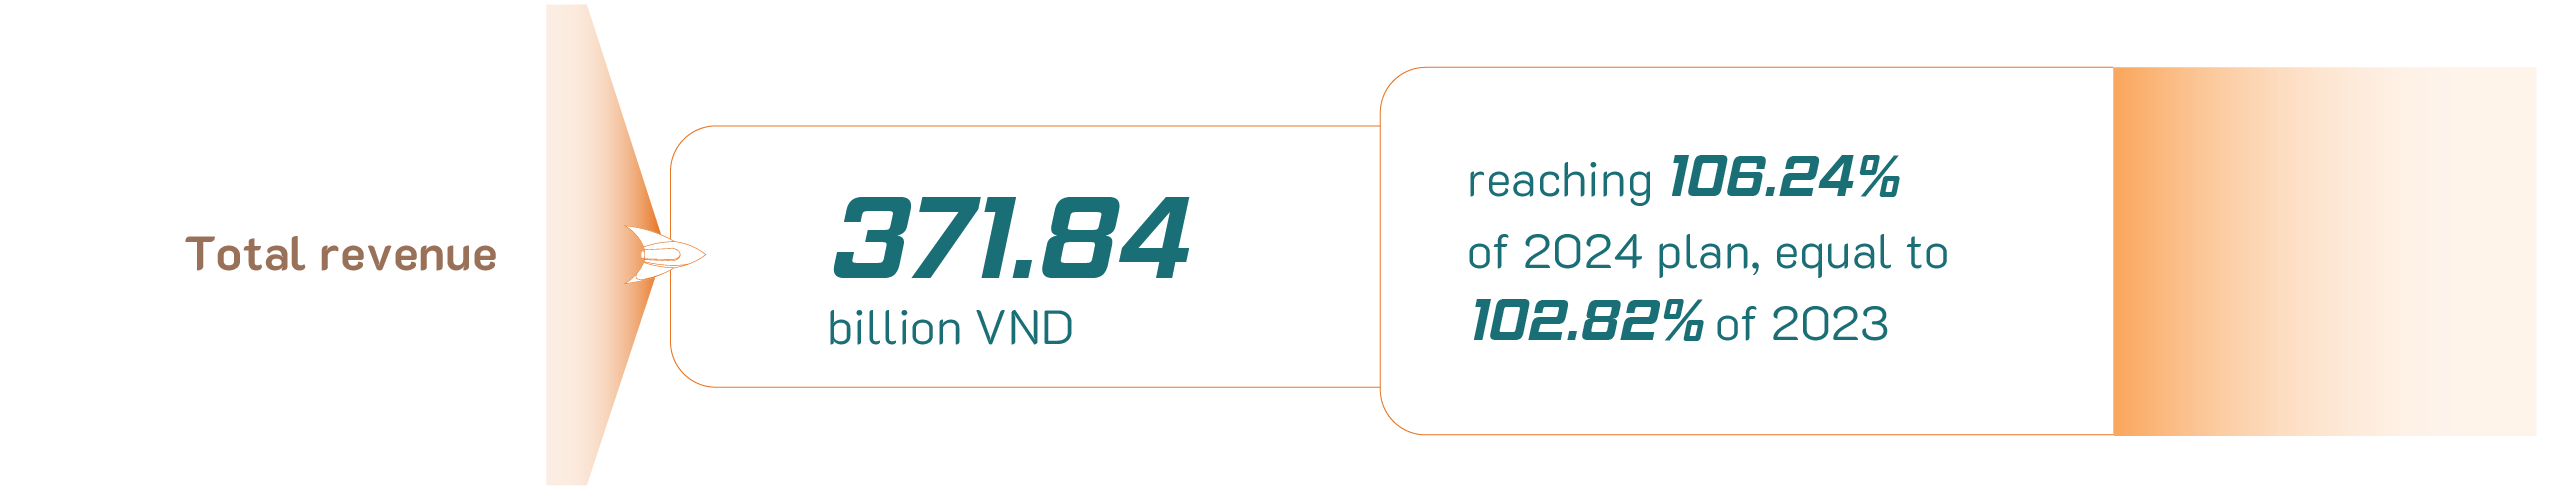

PPC has completed the assigned plan targets, in which the profit reached 114.14% of 2024 plan and equal to 102.93% compared to the same period in 2023 thanks to PPC’s cost saving, optimizing production and seeking contracts with external customers.
PERFORMANCE OF SUBSIDIARY – KOREA-VIETNAM FERTILIZER COMPANY LIMITED (KVF)
KVF’s production and business performance since PVCFC officially took over (from April 2024 to December 2024) is as follows:
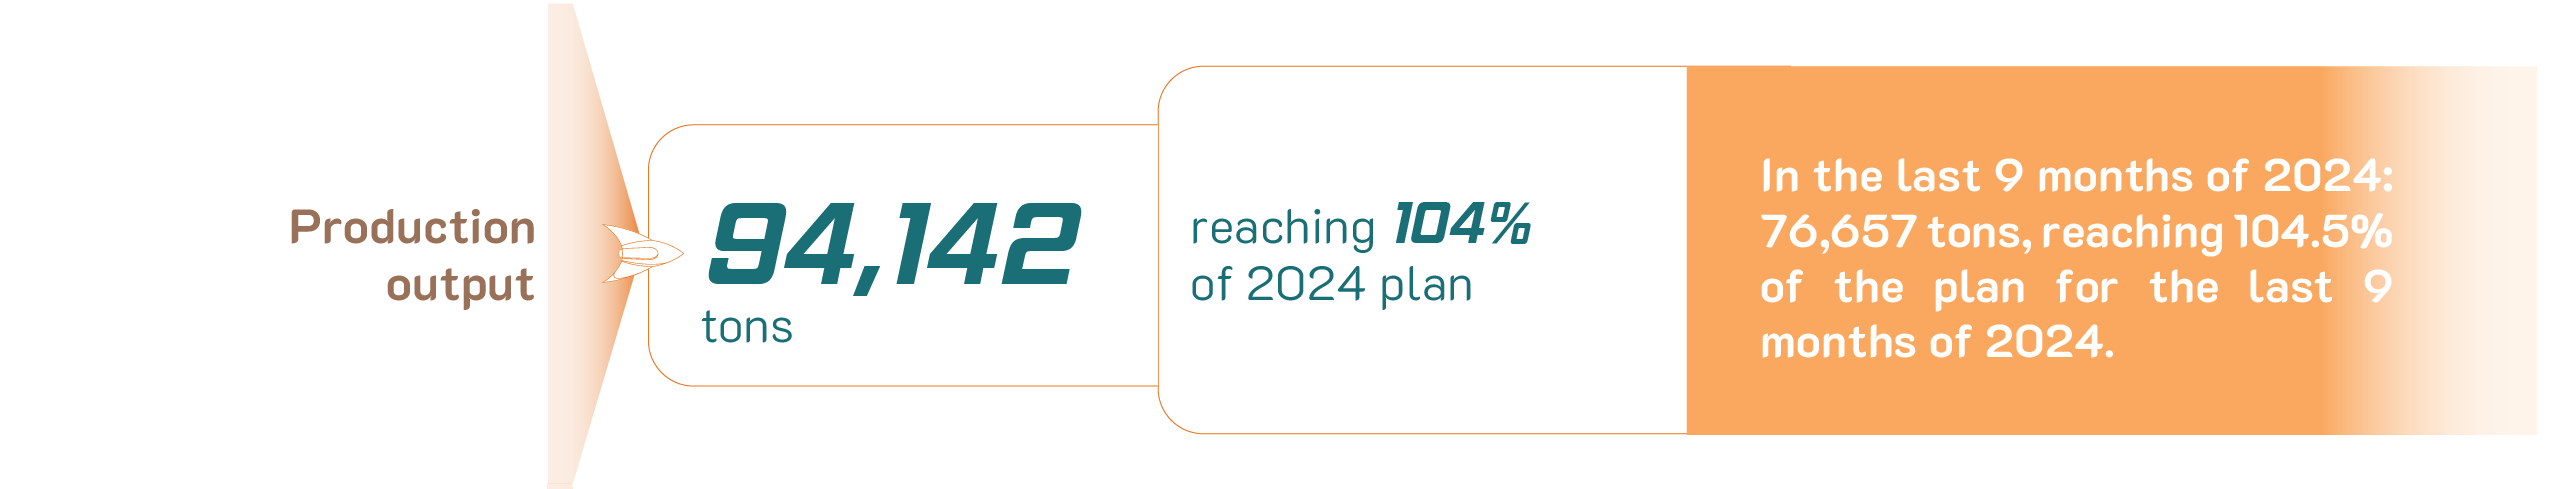
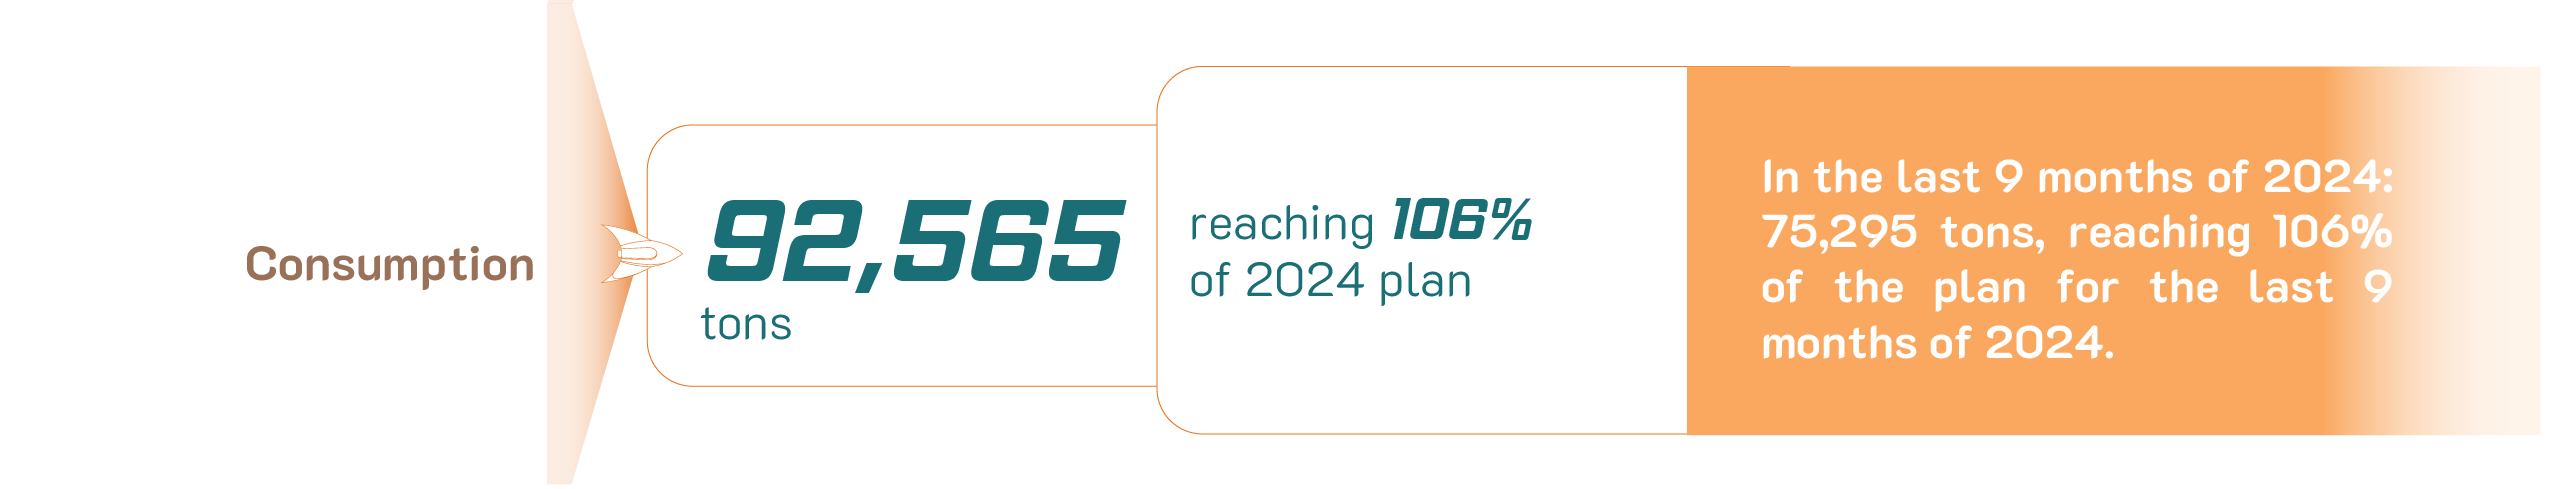
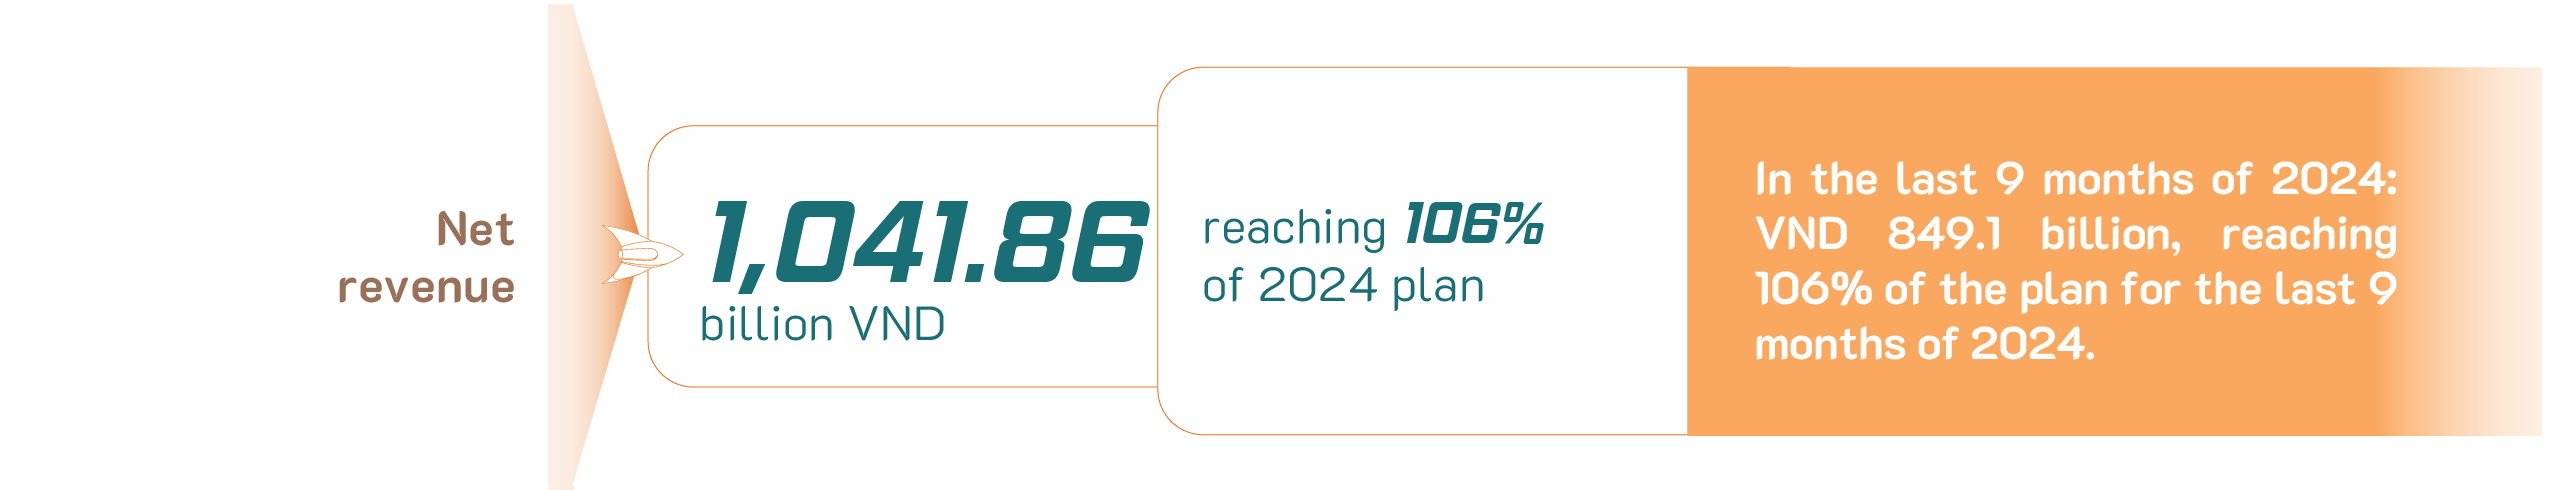
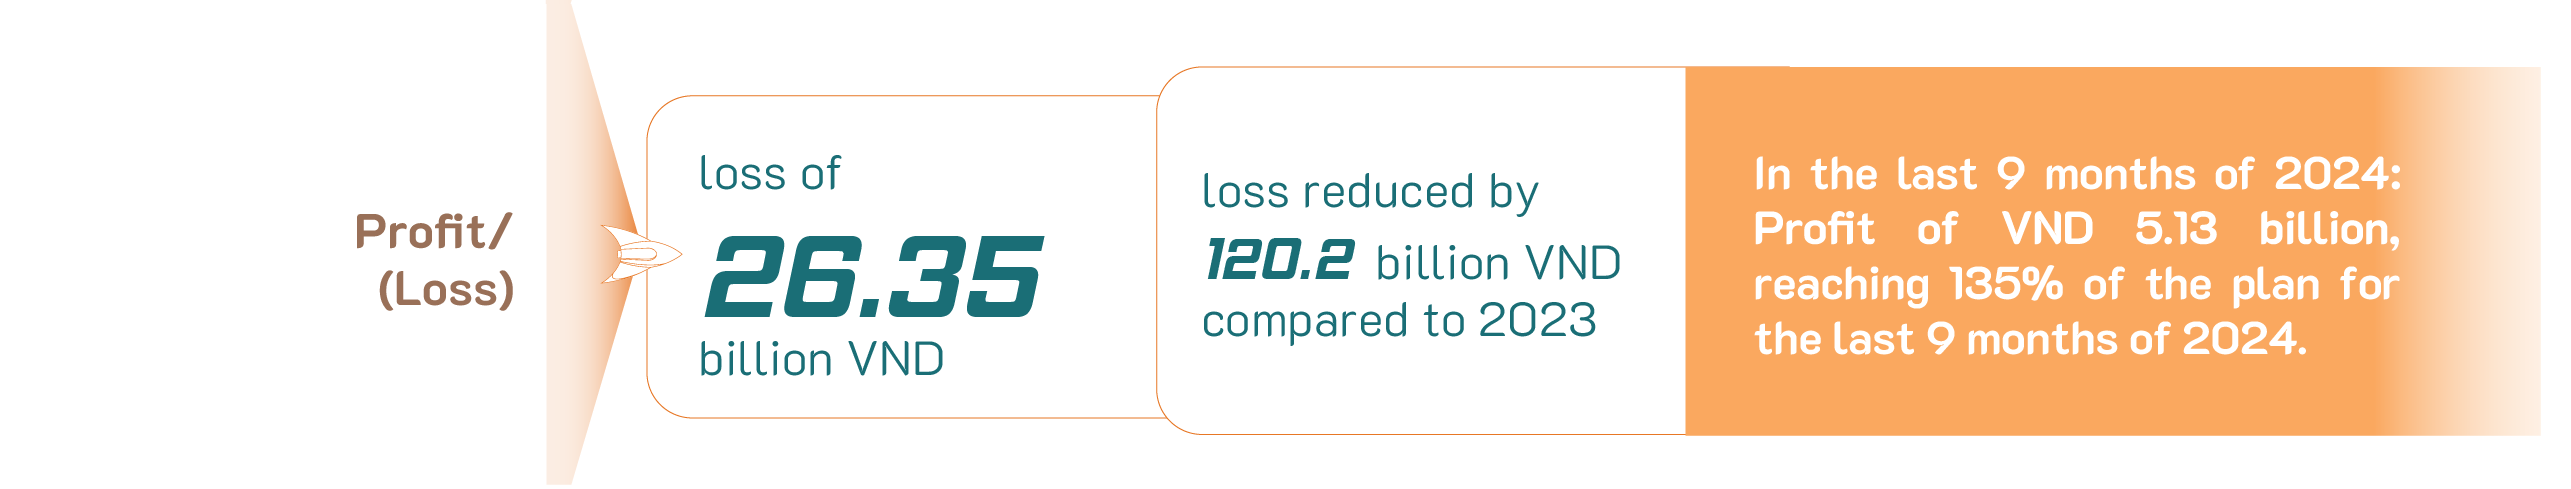
Since its acquisition, KVF has completed organizational structure, consolidated Trade Union and completed policies, procedures, and digital transformation (ERP, Eoffice, etc.) to synchronize with the Parent company. In addition, KVF also cooperated with the Parent company’s Sales Department to approach and dominate the Southeast market.
CONSOLIDATED FINANCIAL SITUATION
UNIT: billion VND
| Financial indicators | 2023 | 2024 | Increase/ (Decrease) |
|---|---|---|---|
| Total assets | 15,238 | 15,729 | 3% |
| Net revenue | 15,571 | 13,456 | 7% |
| Net operating profit/(loss) | 1,232 | 1,323 | 7% |
| Other profit/(loss) | 22 | 199 | 784% |
| Profit before tax | 1,255 | 1,522 | 21% |
| Profit after tax | 1,110 | 1,428 | 29% |
KEY FINANCIAL RATIOS
| NO. | FINANCIAL RATIOS | UNIT | 2023 | 2024 |
|---|---|---|---|---|
| 1 | Solvency ratio | |||
| Current ratio | Times | 2.99 | 2.76 | |
| Quick ratio | Times | 2.51 | 2.13 | |
| 2 | Capital structure ratios | |||
| Debt-to-total assets ratio | % | 35% | 35% | |
| Debt-to-equity ratio | % | 53% | 55% | |
| 3 | Operating ratios | |||
| Inventory Turnover | Date | 4.74 | 4.28 | |
| Net revenue/Total assets | % | 82.49% | 85.55% | |
| 4 | Profitability ratios | |||
| Net profit/Net revenue | % | 8.83% | 10.61% | |
| Net profit/Total revenue | % | 9.53% | 10.84% | |
| Return on Equity (ROE) | % | 10.79% | 14.18% | |
| Return on Assets (ROA) | % | 7.55% | 9.22% |