Overcome challenges
BREAK LIMITS
OVERVIEW OF FERTILIZER INDUSTRY 2024
GLOBAL UREA MARKET
million tons of UREA
PRODUCED IN 2024
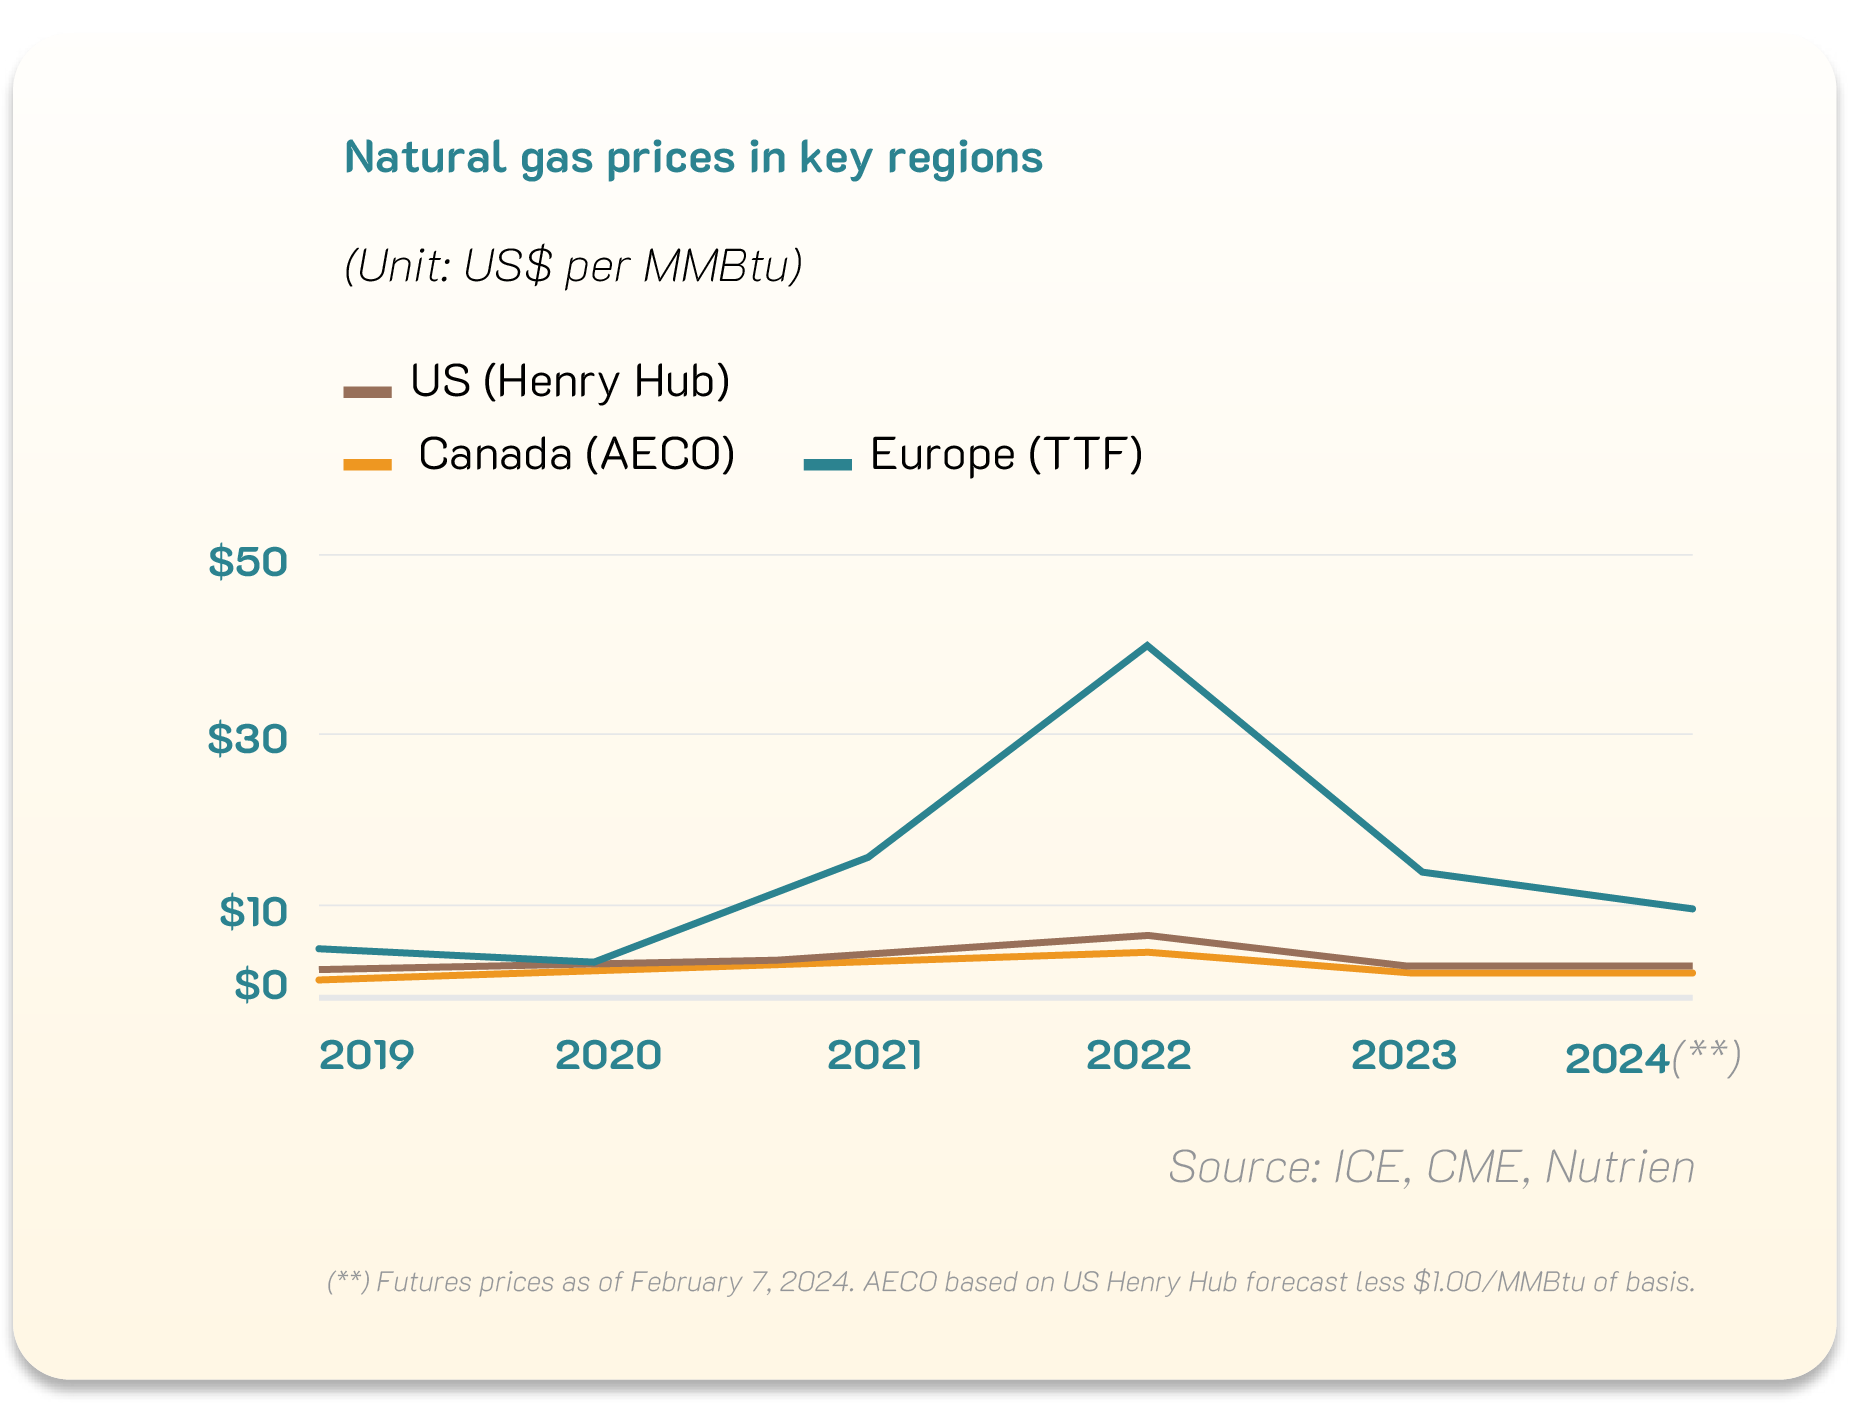
Production:Urea production is highly dependent on natural gas prices, which is the main input material for production. In 2024, despite its decrease compared to the pre-COVID-19 period, gas prices remained high in some regions, particularly Europe. This is due to the Russia-Ukraine conflict persisted since early 2022 with no signs of cooling down.
Major urea-producing countries such as China, India, and the Middle East continue to dominate the global market. In 2024, 187 million tons of urea were produced, as estimated, mainly in Saudi Arabia, Qatar, Russia, China, and India.
Consumption: Despite high nominal consumption, the growth rate of urea demand has slowed due to rising prices and a shift towards more environmentally efficient fertilizers. The largest consumers include India, China, and Brazil, which are among the major markets worldwide. Additionally, countries such as the United States, Australia, Argentina, Pakistan, Bangladesh, Ethiopia, and several European nations have imported and consumed a large amount of fertilizers.
The United States remains a significant importer of urea and a key driver of global trade, despite a notable increase in domestic production capacity over the past decade. China and India are the largest nitrogen fertilizer consumers, accounting for approximately 40% of global urea demand.
million tons
GLOBAL UREA CONSUMPTION IN 2024
In 2024, the estimated consumption of global urea, in both agricultural and industrial sectors, reached 193 million tons. The agricultural sector accounts for the majority (over 80% of total consumption), while the remainder is used in various industrial manufacturing sectors such as adhesives, automotive, and others.
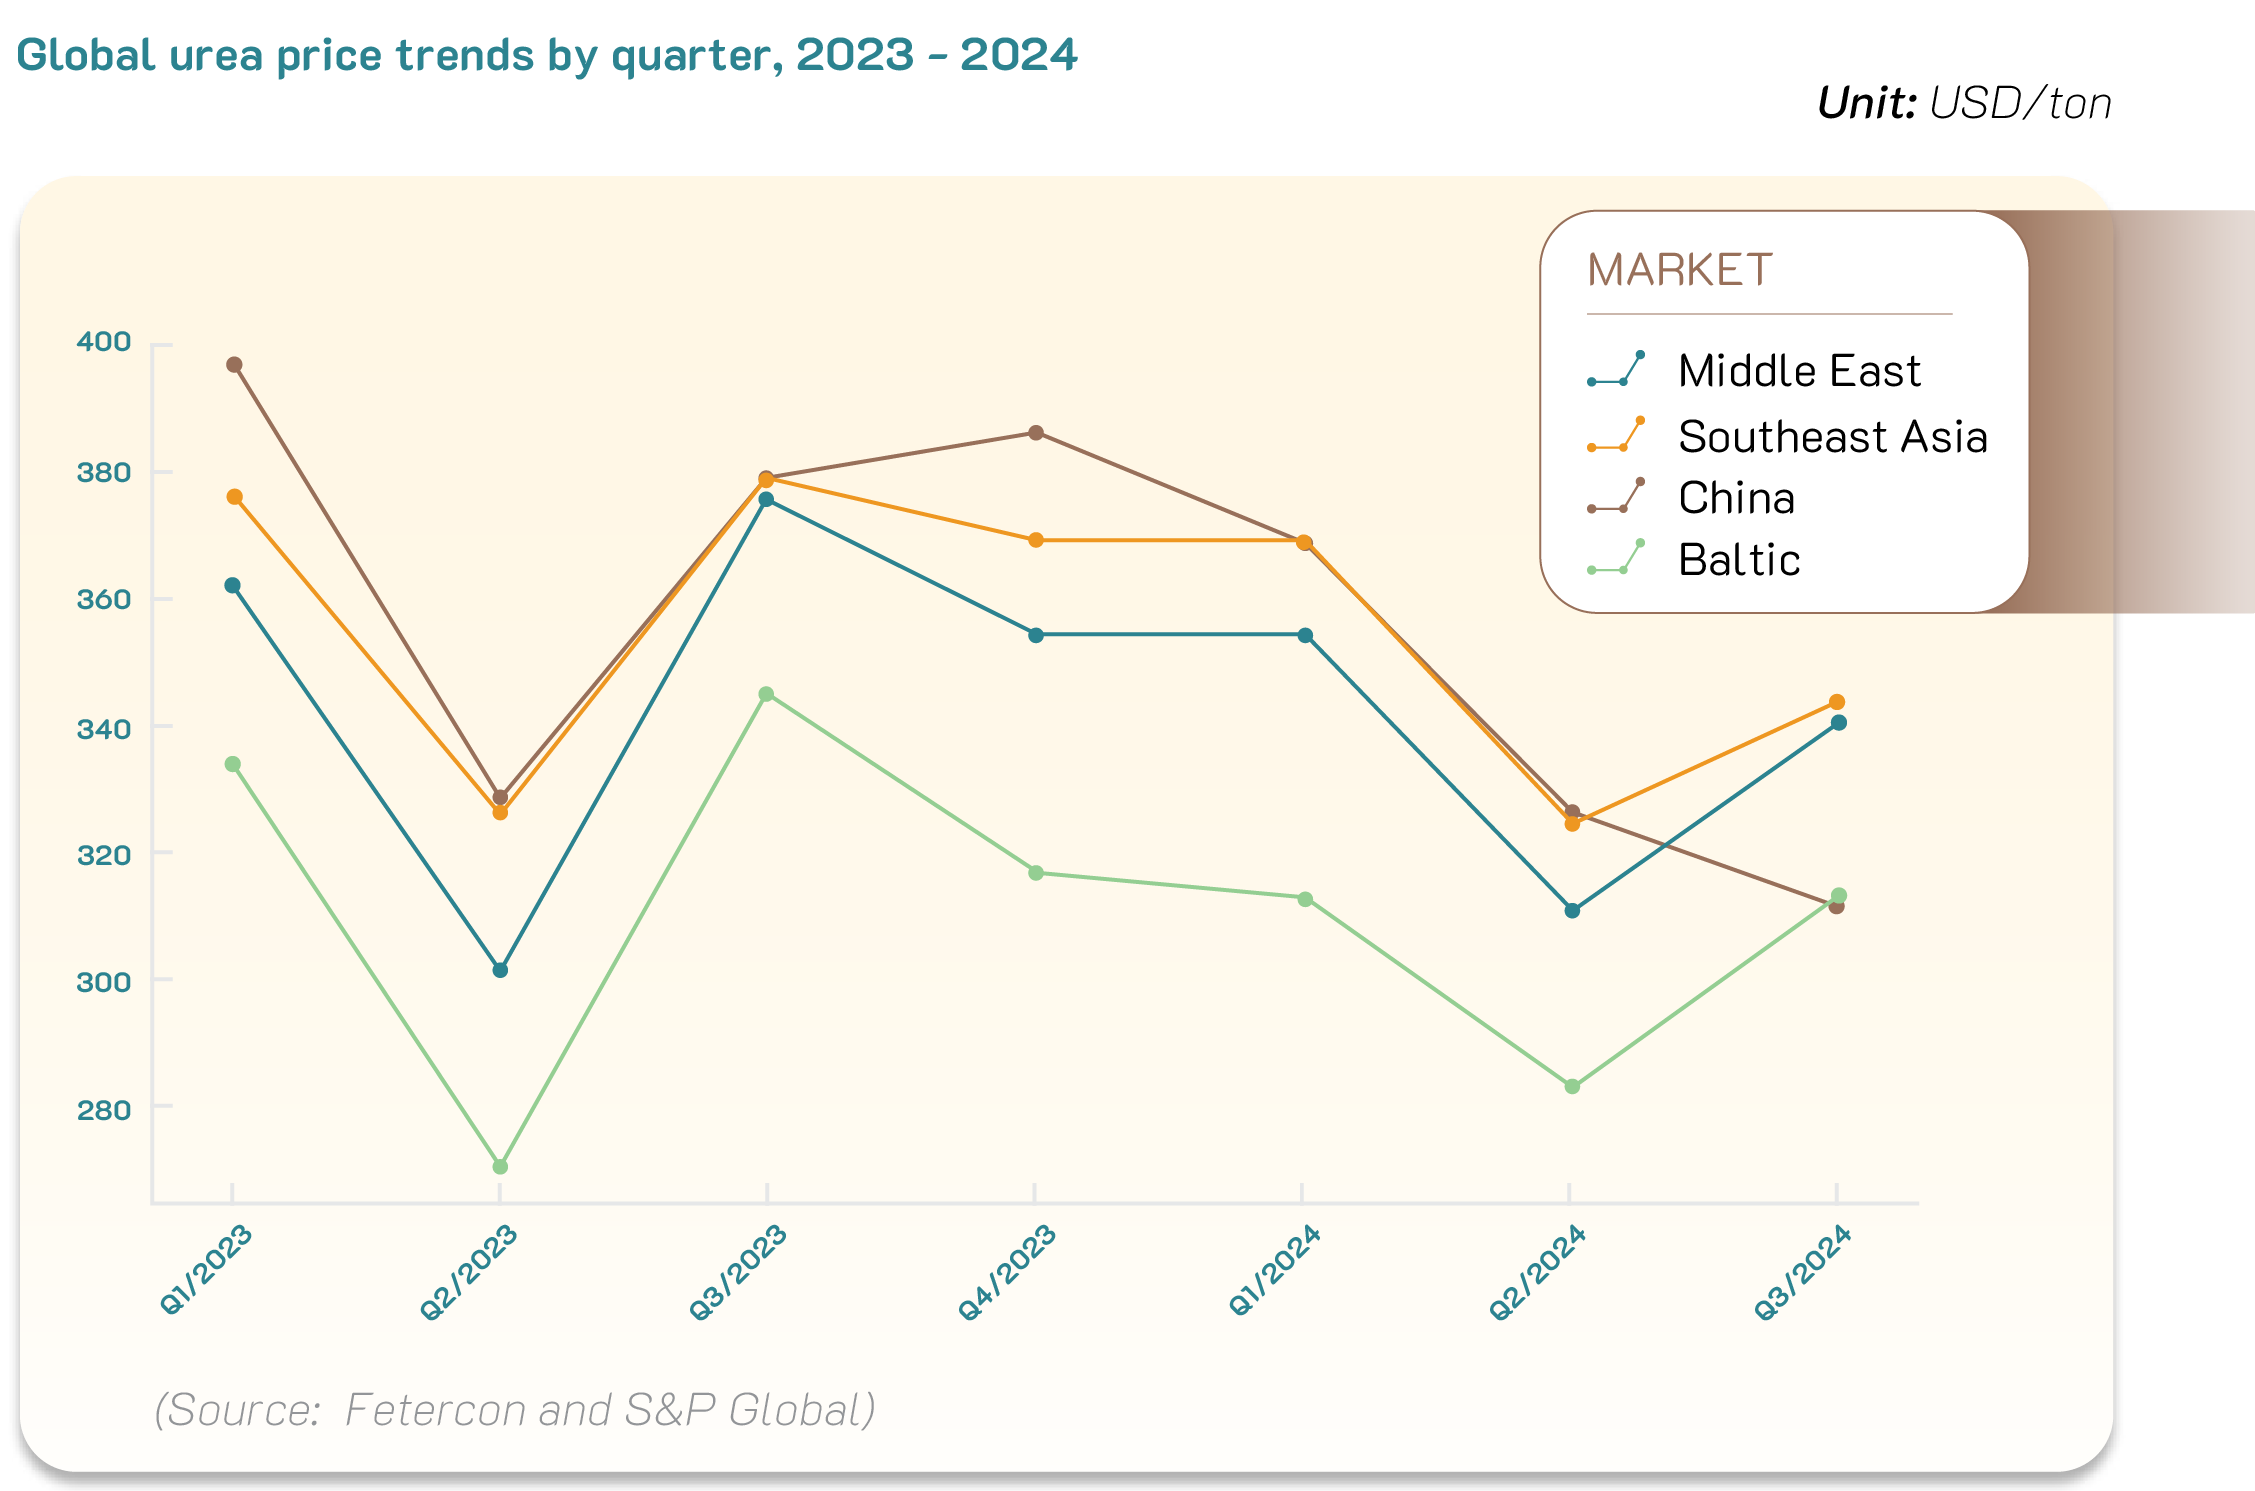
Pricing: After the price adjustment in Q3 and Q4 of 2023, urea price has shown signs of recovery since Q2 of 2024. In general, Southeast Asia continued to maintain a higher price compared to China and the Baltic region, but still lower than the Middle East, as the increase in supply pressure in the region compared to the previous period.
GLOBAL POTASSIUM MARKET
million tons
GLOBAL POTASSIUM PRODUCTION IN 2024
Production: an estimated amount of 65 million tons of potassium was produced worldwide in 2024, mainly in Canada (approximately accounting for 30% of global production). Russia, Belarus, and Israel are also major suppliers of potassium to the global market.
High-quality potassium sources in large quantities are limited to a few countries. Canada is the world’s largest producer and exporter of potassium, accounting for 40% of total reserves. More than 75% of the world’s potassium production comes from the six largest producers. Therefore, these producers have a significant influence on not only the supply chain but also potassium price in the world.
By 2024, Canada has the world’s largest potassium reserves with 1.1 billion tons, mainly produced in Saskatchewan, where many potassium mines operate. Belarus GLOBAL POTASSIUM PRODUCTION IN 2024 65 million tons holds 750 million tons of potassium, with Belarus Kali as the largest producer who has large reserves and plays an important role in the global market. Russia has 650 million tons, with Uralkali as a major producer; but facing impacts of economic sanctions. Despite being the world’s largest consumer, China holds around 180 million tons of potassium and imports a large amount of potassium to meet domestic demand. Germany has some large potassium mines and is one of the key producers in Europe, with the reserves estimated at 150 million tons. Israel holds around 100 millions of potassium, mainly produced from the mines in the Dead Sea, in which Israel Chemicals is the leading potassium producer.
Due to the Western sanctions in recent years, the exportation activities of Russia and Belarus are restricted, affecting supply sources in some regions. However, through intermediary countries, the supply sources have shifted towards the major markets such as China, Brazil, Argentina, Mexico, and Europe. Thanks to that, the disruption in potassium supply chain has eased compared to previous years.
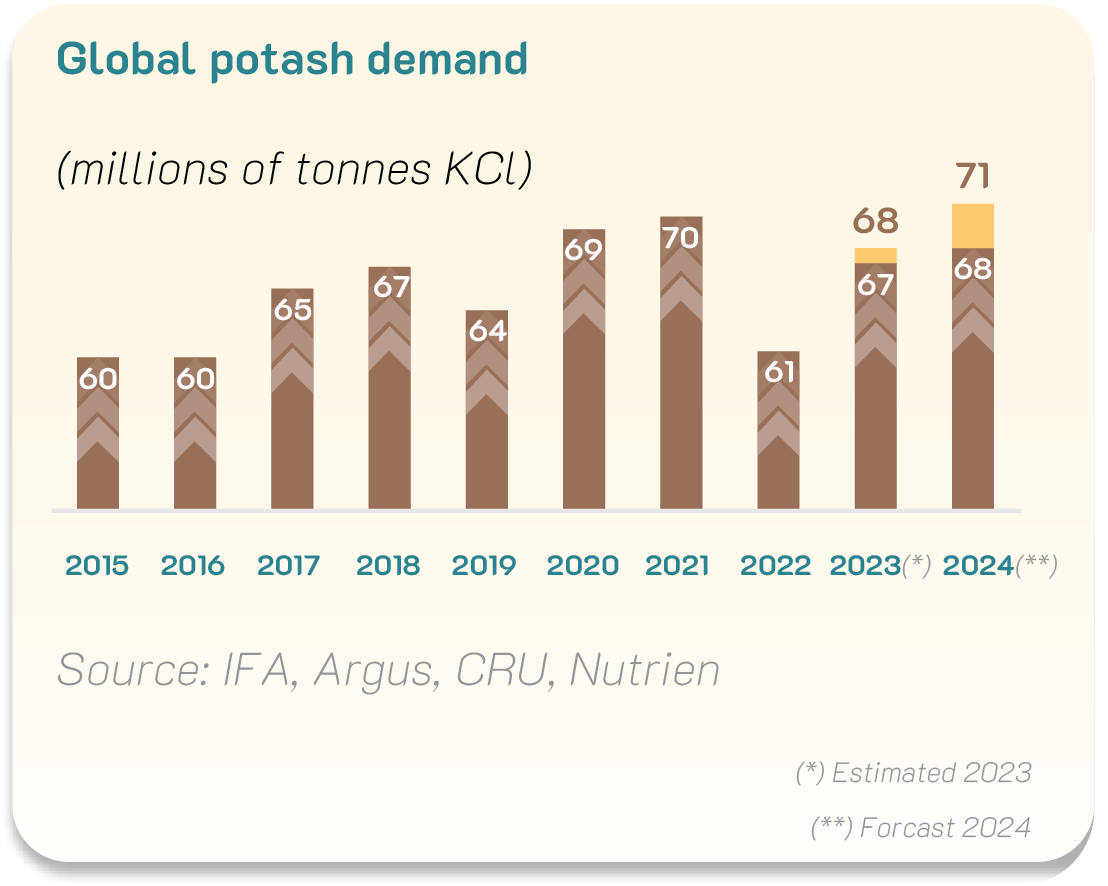
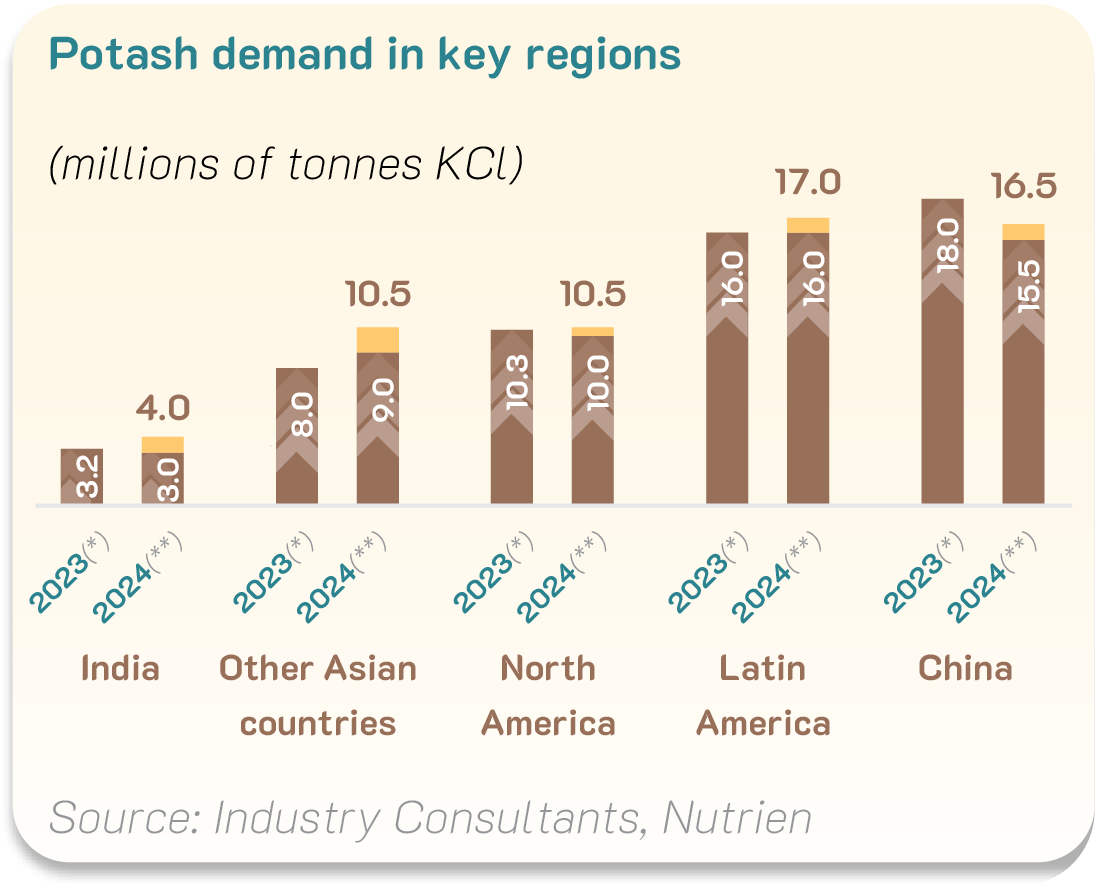
Consumption:In 2024, the world’s potassium consumption reached 71 million tons as estimated, up 4.4%, equivalent to 3 million tons from 2023, 68 million tons, mainly due to the growth of key regions/countries such as China, 16.5 million tons and Latin America, 17 million tons, in which Brazil consumed around 10 million tons; North America, 10.5 million tons; and other Asian countries, around 10.5 million tons. Indonesia is the largest potassium consumer in Southeast Asia. Along with China and India, this country has certain effects on potassium price in the region.
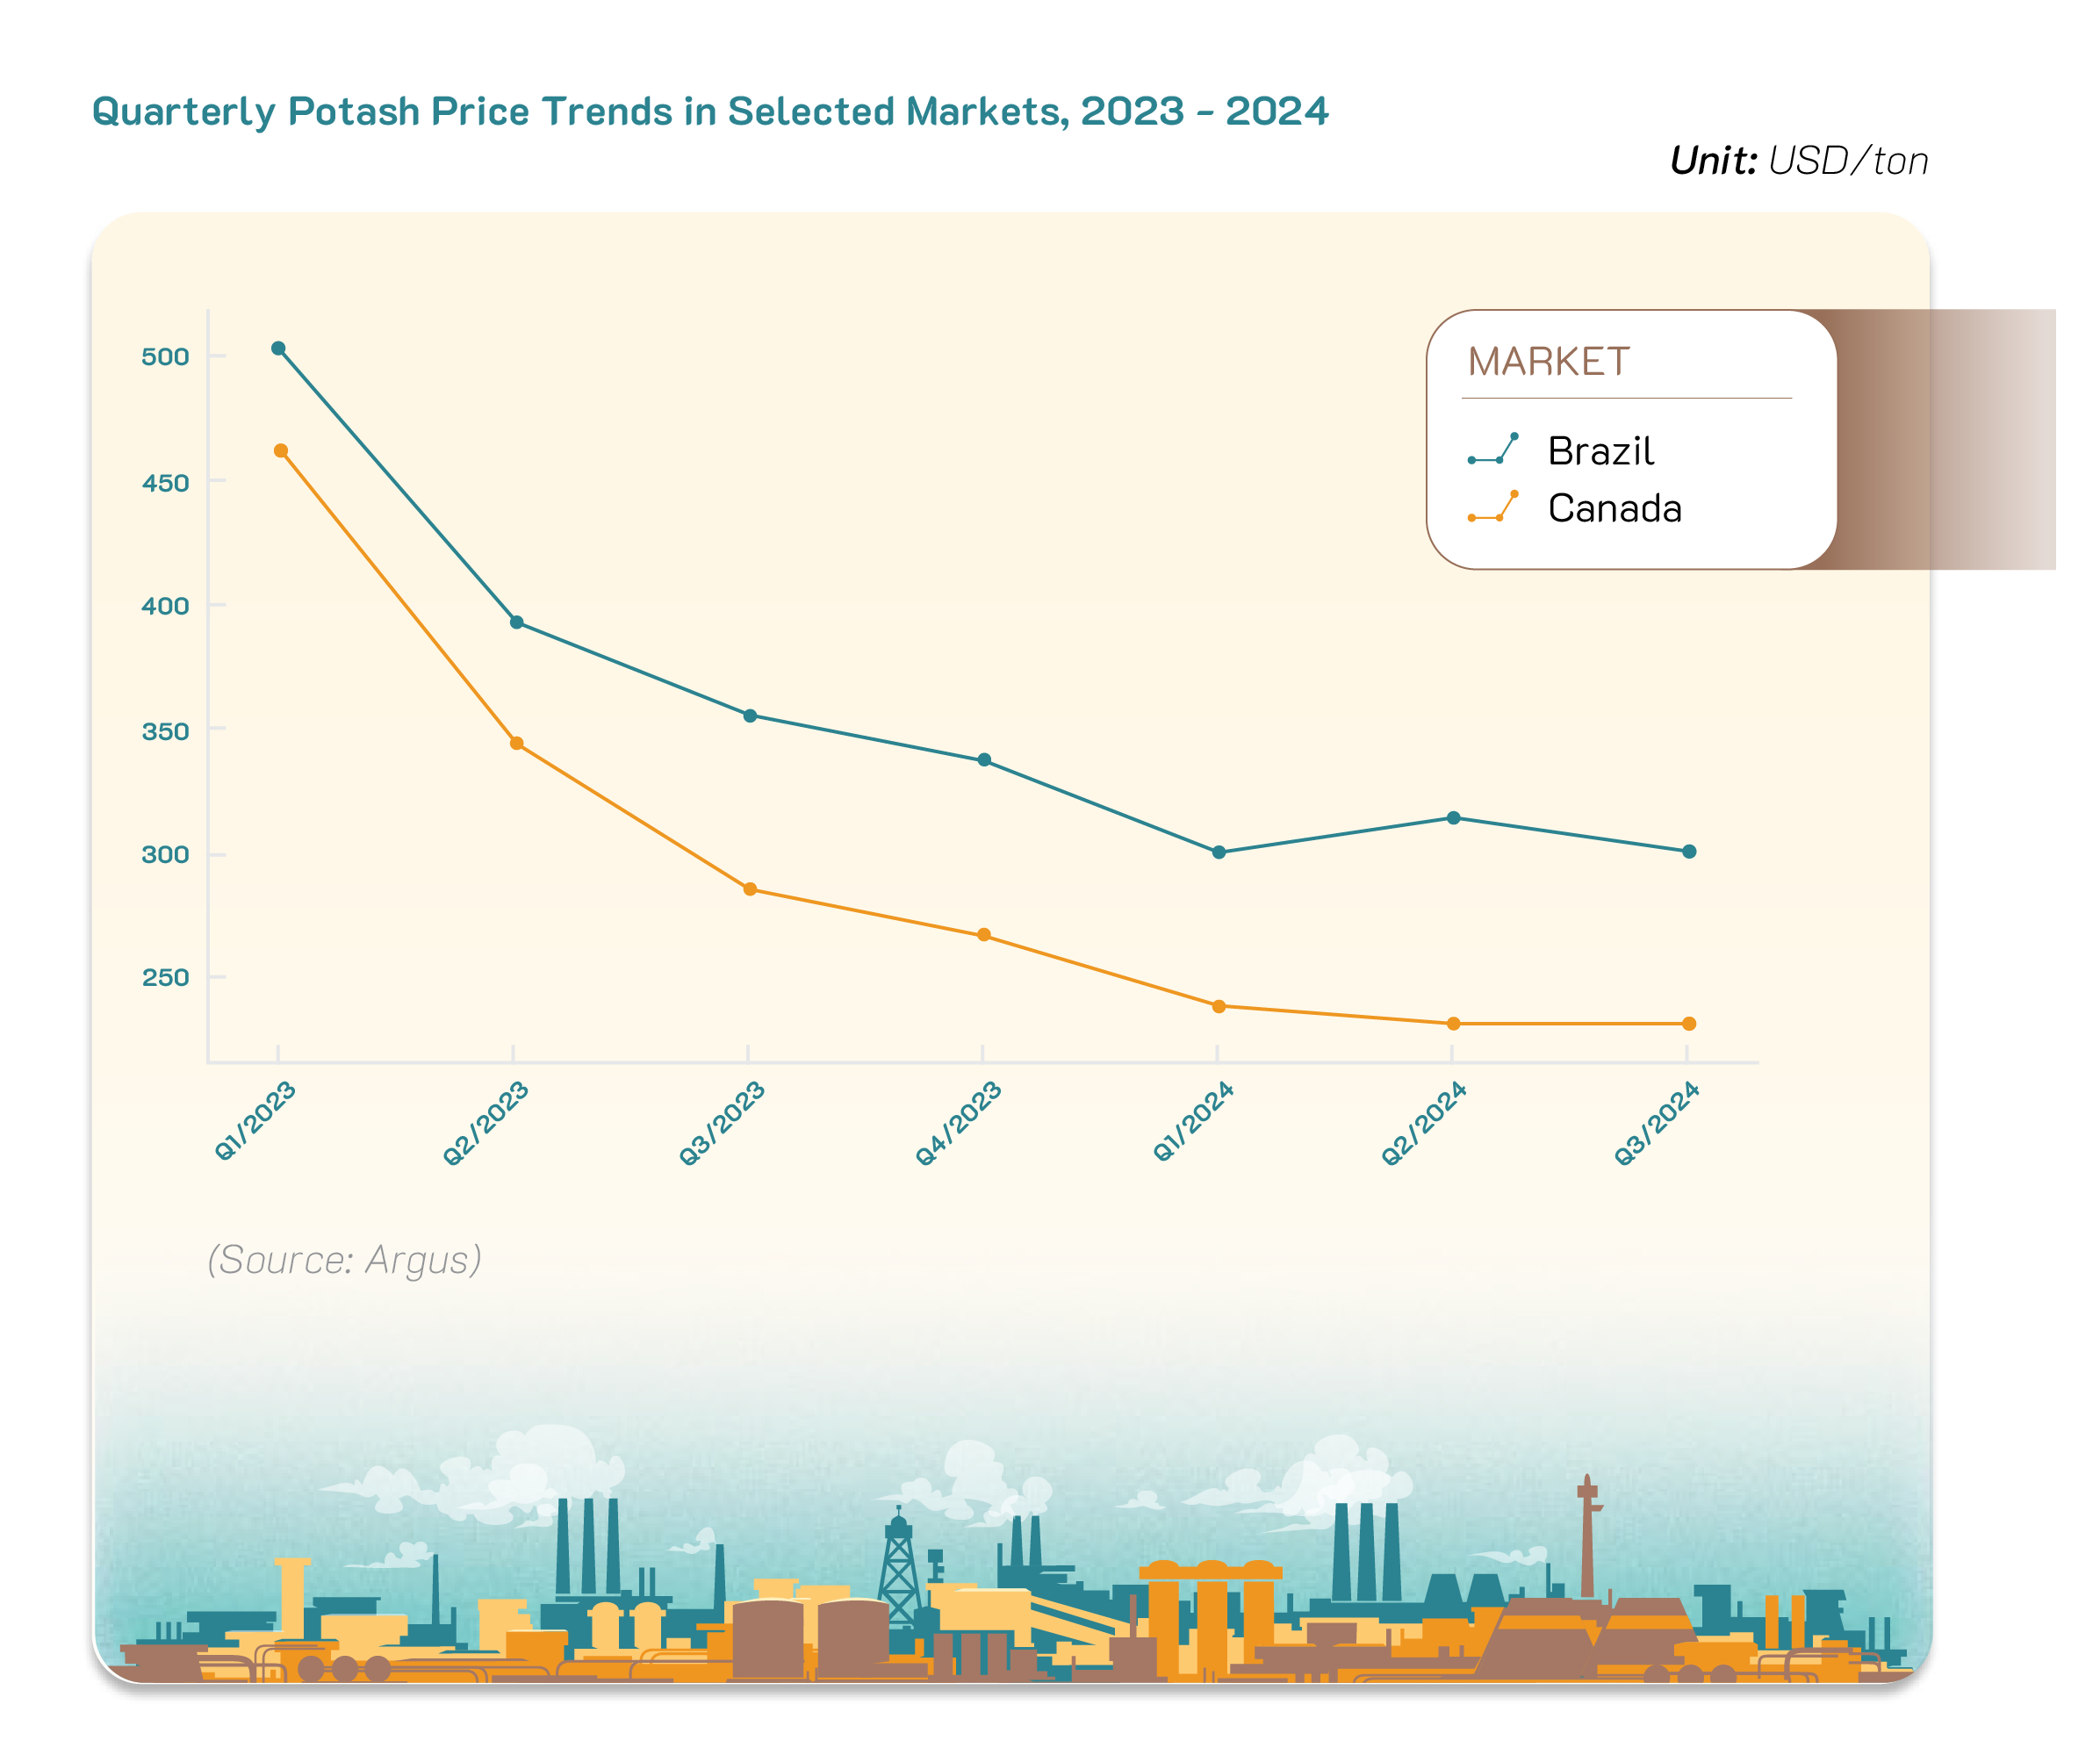
Pricing: Potassium price in 2024 experienced significant fluctuations, following a much sharper decline compared to 2023. This results from the improvement in supply sources in Russia and Belarus and the import decrease in some major markets such as the United States and Brazil, where the supply from previous years is still abundant, affecting the global potassium price.
GLOBAL DAP MARKET
Production: China, Morocco, Russia, Saudi Arabia, Egypt, Tunisia, Algeria, South Africa, and Brazil are the world’s leading countries in DAP/MAP supply while phosphate production in the United States has significantly dropped, by 30% over the past decade as estimated. At present, Morocco holds the largest phosphate reserves in the world with 50 billion tons, accounting for approximately 70% of the global reserves. This country is also the major DAP/MAP producer. China is not only one of the largest DAP producers but also plays a crucial role in the global fertilizer industry with reserves of around 3.8 billion tons. Egypt is one of the largest DAP/ MAP producers with a welldeveloped fertilizer industry and reserves of 2.8 billion tons. Tunisia, located in North Africa, holds significant phosphate reserves of around 2.5 billion tons and is one of the global leading DAP producers. Saudi Arabia holds approximately 1.4 billion tons. It has increased production in recent years and plans to further expand in the future
China’s trade policy has a significant impact on the global phosphate market. In 2023, China’s DAP/MAP export decreased by approximately 30% from 2021 due to export restrictions imposed by the government to stabilize the domestic market. China continues to enforce restrictions on fertilizer export, including urea, DAP, and MAP (Mono-ammonium Phosphate). The government has required producers to temporarily suspend applications for export certification, lengthened customs clearance and limited fertilizer export turnover.
AS ESTIMATED, THE GLOBAL DAP/ MAP PRODUCTION EXCEEDED
million tons
IN 2024
In terms of production, in 2024, global DAP/MAP production exceeded 50 million tons, as estimated, in which China accounted for 20 million tons and the other came from the United States, Morocco, Russia, and Saudi Arabia
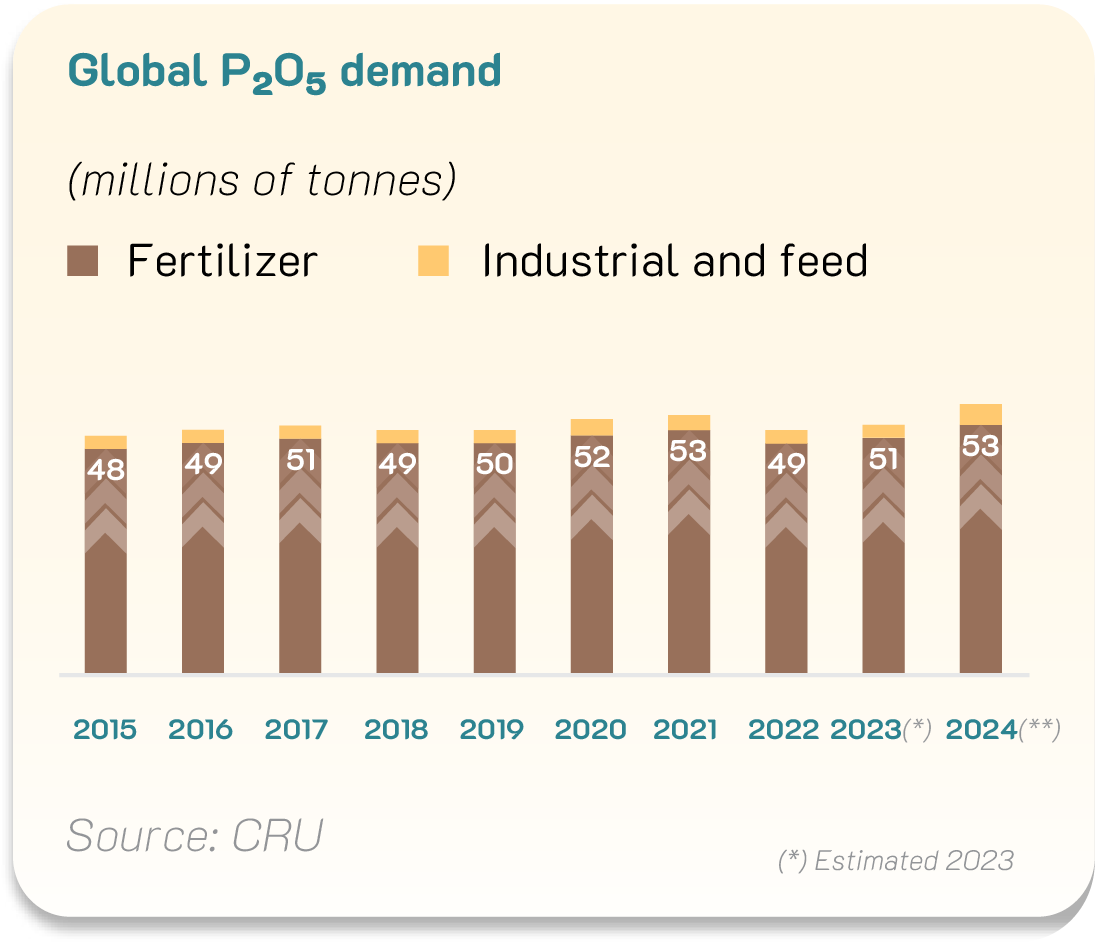
Consumption:In 2024, global DAP/MAP consumption was estimated to reach 53 million tons, an increase of 2 million tons, up 4% from 2023. India and Brazil are the largest DAP/MAP importers due to their low domestic production. These countries also have significant influence on the global DAP/ MAP supply and prices.

In terms of import, major DAP/ MAP importing countries in 2024 include India - more than 5 million tons, Brazil - around 4.5 million tons, the United States - around 1 million tons, Australia - more than 1.2 million tons, and Pakistan - around 0.9 million tons.
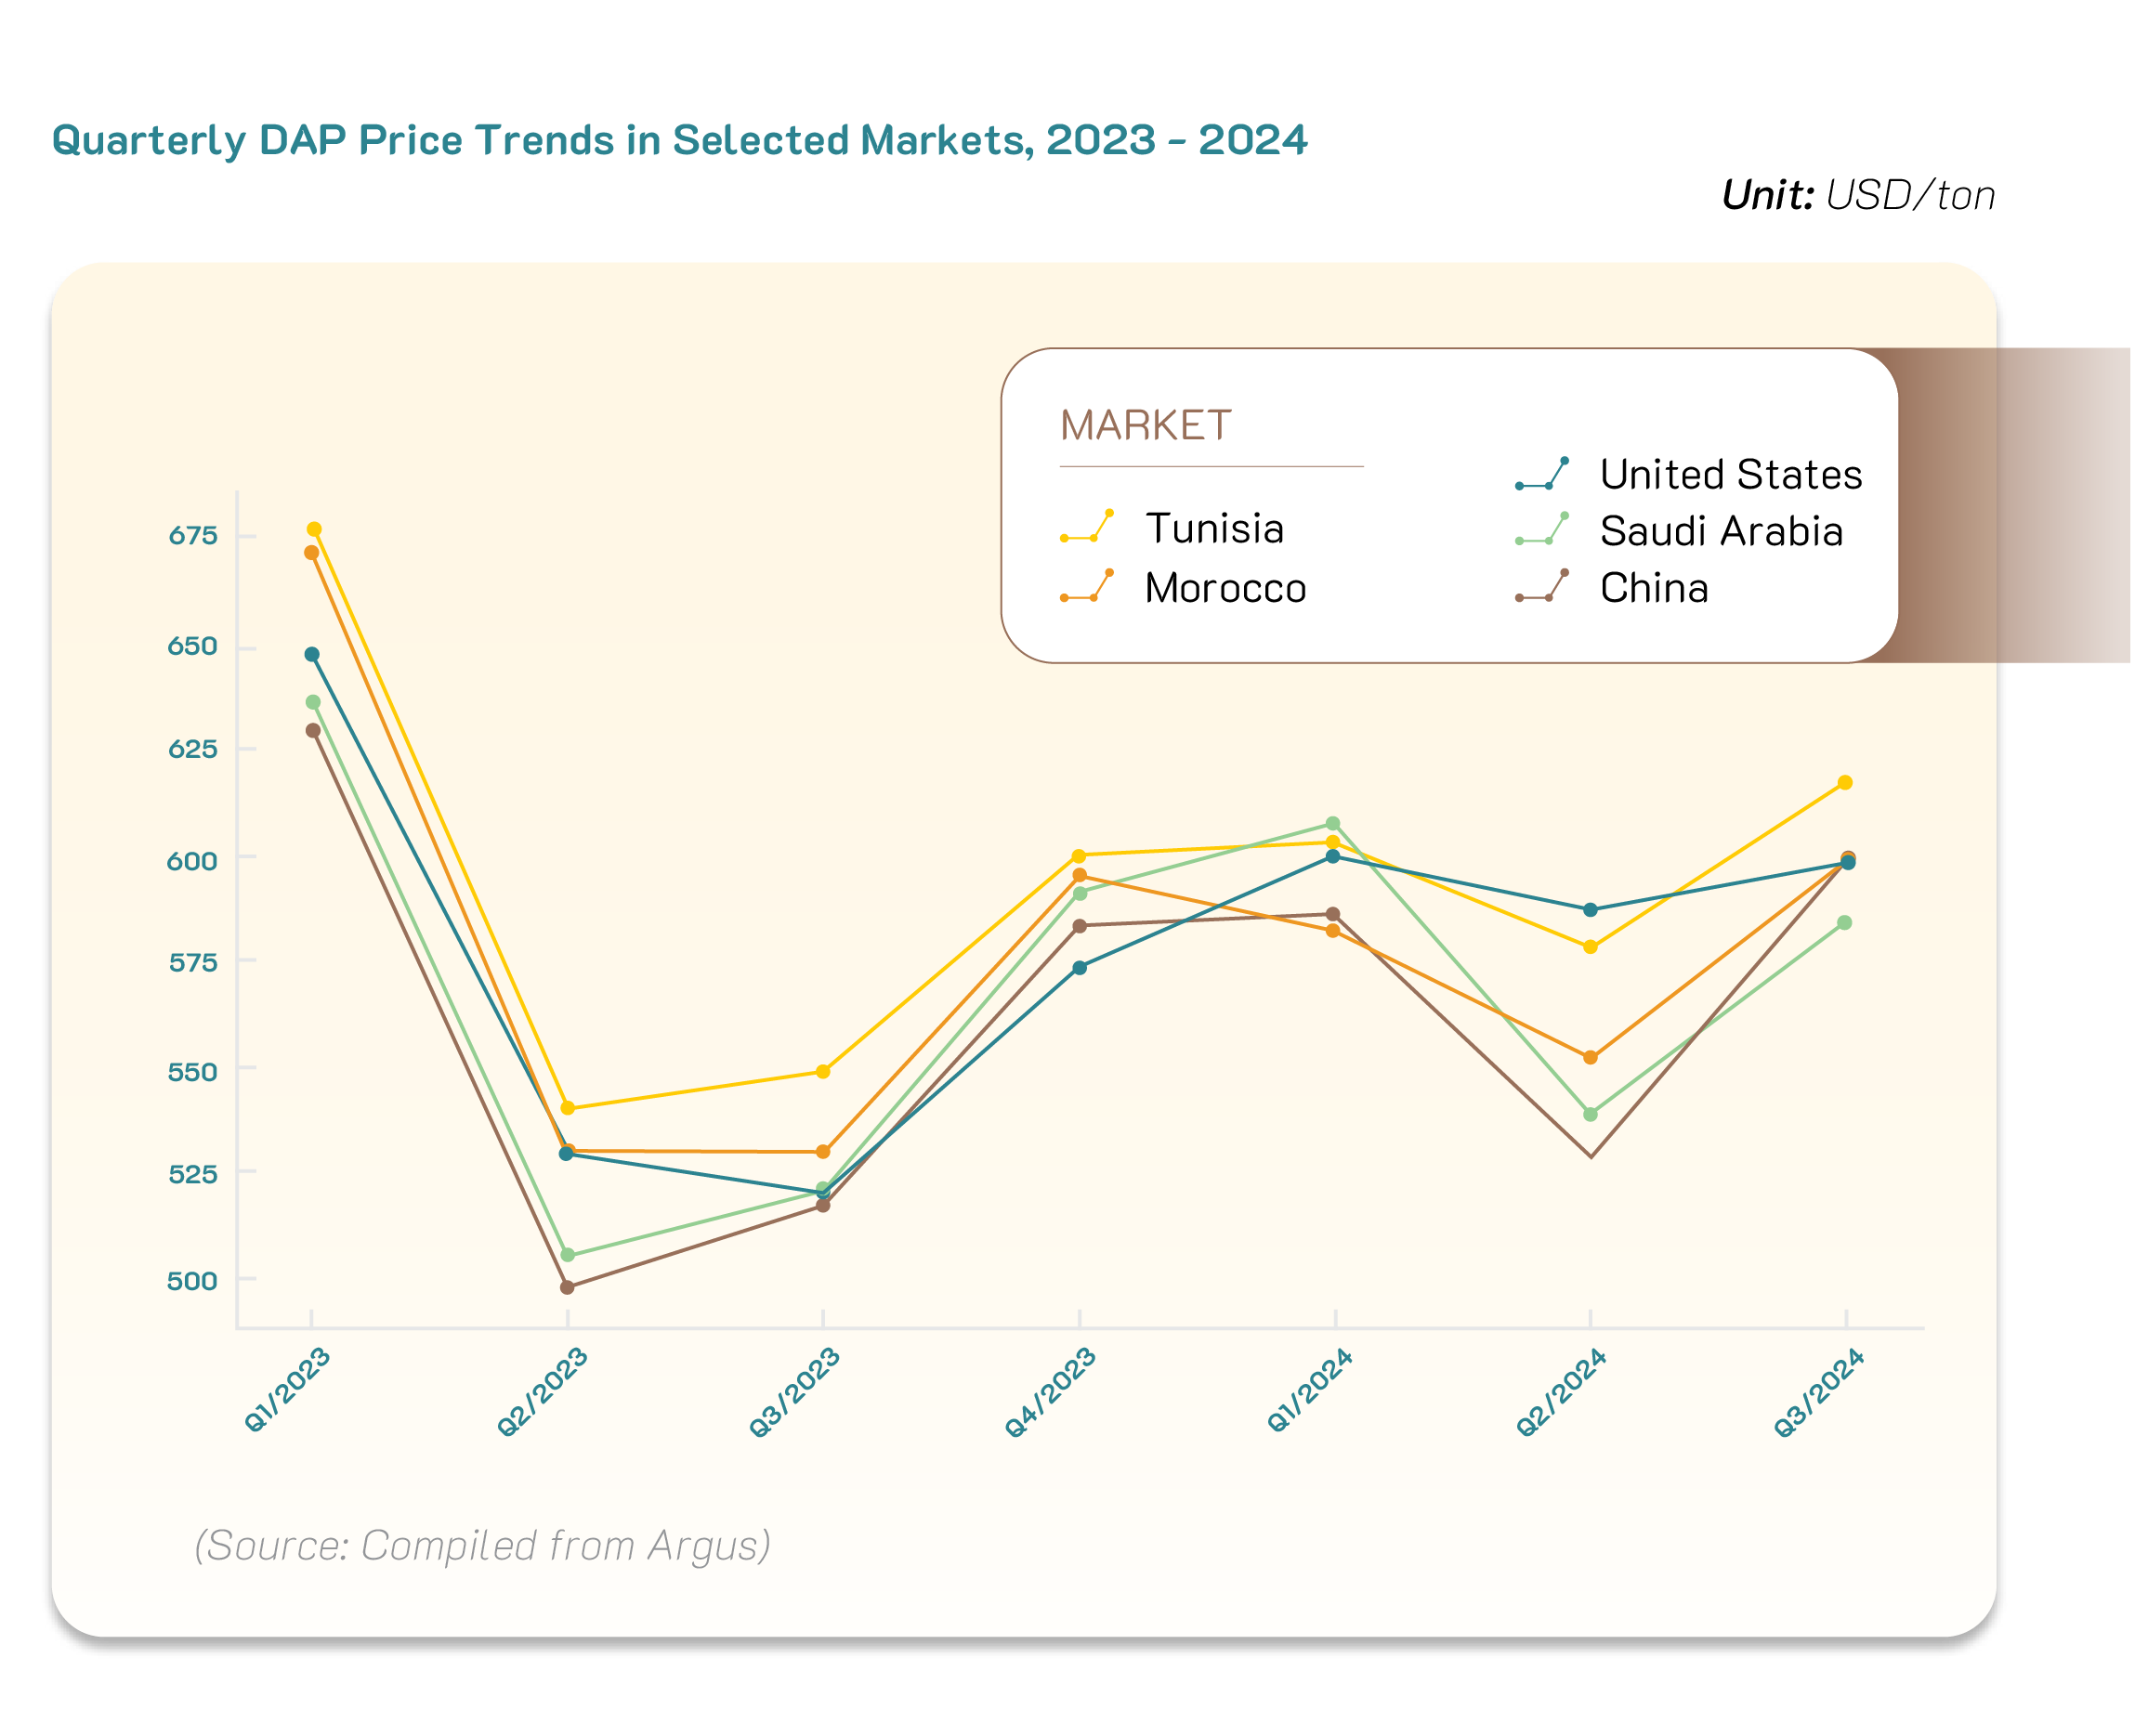
Pricing: DAP price showed a downward trend from Q1/2023, hit the bottom in Q2/2023, and gradually recovered in the last six months of 2023. Entering 2024, DAP price remained stable in Q1/2024, experienced movements in Q2/2024, and recovered to the price seen at the end of the previous year. One of the main reasons for this fluctuation is China’s DAP export restrictions, making it difficult for major importers, especially India, to access the international supply.
GLOBAL NPK MARKET
Production:According to IFA, global NPK production has shown steady growth, increasing from 114.9 million tons in 2016 to 119.0 million tons in 2020, but slightly decreasing to 118.5 million tons in 2021. NPK production in regions such as Western Europe and South Asia remained stable while East Asia experienced a slight decline in production in 2021 compared to 2020. Asia, particularly South Asia, maintained relatively stable production. However, East Asia’s production declined from 72.6 million tons in 2020 to 72.5 million tons in 2021. Central Europe saw a production decrease from 5.1 million tons in 2017 to 4.2 million tons in 2021, due to the impact of environmental policies and price fluctuations. Western Europe has maintained stable production at approximately 14.9 million tons from 2019 to 2021.
| AREA | 2016 | 2017 | 2018 | 2019 | 2020 | 2021 |
|---|---|---|---|---|---|---|
| West Europe | 14.9 | 14.9 | 15.0 | 15.0 | 14.9 | 14.9 |
| Central Europe | 4.6 | 5.1 | 5.0 | 4.8 | 4.9 | 4.2 |
| EECA | 10.9 | 11.2 | 11.4 | 11.4 | 11.3 | 11.4 |
| Americas | 3.2 | 3.2 | 3.3 | 3.6 | 3.6 | 3.6 |
| Africa | 3.3 | 3.2 | 3.2 | 3.2 | 3.2 | 3.3 |
| West Asia | 3.6 | 4.4 | 4.4 | 4.5 | 4.8 | 4.8 |
| South Asia | 3.4 | 3.4 | 3.5 | 3.2 | 3.8 | 3.7 |
| East Asia | 71.1 | 71.2 | 73.7 | 72.2 | 72.5 | 72.6 |
| WORLD | 114.9 | 116.7 | 119.5 | 117.9 | 119.0 | 118.5 |
Based on IFA’s NPK production report for the 2016 - 2021 period, the estimated NPK production for the 2022 - 2024 period is 120 - 122 million tons. This increase can be attributed to the rising demand from the agricultural sector, driven by global population growth, which boosts food demand and expands cultivated land areas. Additionally, the growing demand for organic fertilizers and sustainable agricultural solutions has contributed to the development of new NPK products.
THE TOTAL GLOBAL NPK CONSUMPTION IS ESTIMATED TO REACH
million tons
IN 2034
Consumption:According to Argus, global NPK consumption in 2020 was 99.7 million tons and is projected to increase to approximately 107.2 million tons by 2034, with a compound annual growth rate (CAGR) of around 0.5% per year. Accordingly, Africa is expected to experience the strongest growth, rising from 2.5 million tons in 2020 to 5.7 million tons in 2034, with a CAGR of 6.0%. This reflects agricultural development and increasing food demand driven by population growth. South Asia is expected to see more modest growth, with consumption increasing from 5.2 million tons to 5.5 million tons, corresponding to a CAGR of 0.4%. Northeast Asia shows a slight decline in consumption, projected to decrease from 63.8 million tons to 63.1 million tons. Western Europe maintains relatively stable consumption but lacks significant growth, while Central and Eastern Europe show modest growth. North America is forecasted to have low growth.
Forecast growth in regional NPK consumption, 2020-34
| REGIONS | 2020 | 2024 | 2029 | 2034 | +/- 2020-34 |
CAGR 2020-34 |
|---|---|---|---|---|---|---|
| Northeast Asia | 63,790 | 65,107 | 64,021 | 63,082 | -707 | -0.1% |
| Southeast Asia | 12,613 | 13,591 | 13,995 | 14,202 | 1,589 | 0.9% |
| Central and eastern Europe | 4,188 | 4,586 | 4,636 | 4,730 | 542 | 0.9% |
| Africa | 2,505 | 4,134 | 4,877 | 5,670 | 3,165 | 6.0% |
| Russia and central Asia | 1,465 | 1,510 | 1,736 | 1,860 | 395 | 1.7% |
| South Asia | 5,200 | 5,331 | 5,394 | 5,462 | 262 | 0.4% |
| Latin America and Caribbean | 2,774 | 3,556 | 3,961 | 4,279 | 1,505 | 3.1% |
| Western Europe | 5,090 | 4,921 | 5,092 | 5,327 | 237 | 0.3% |
| Middle East | 1,348 | 1,404 | 1,501 | 1,649 | 300 | 1.4% |
| North America | 717 | 723 | 722 | 721 | 4 | 0.0% |
| Australasia | 70 | 107 | 148 | 184 | 115 | 7.2% |
| Global Total | 99,760 | 104,970 | 106,083 | 107,166 | 7,406 | 0.5% |
BASED ON CURRENT TRENDS, GLOBAL NPK CONSUMPTION CAN REACH APPROXIMATELY
million tons
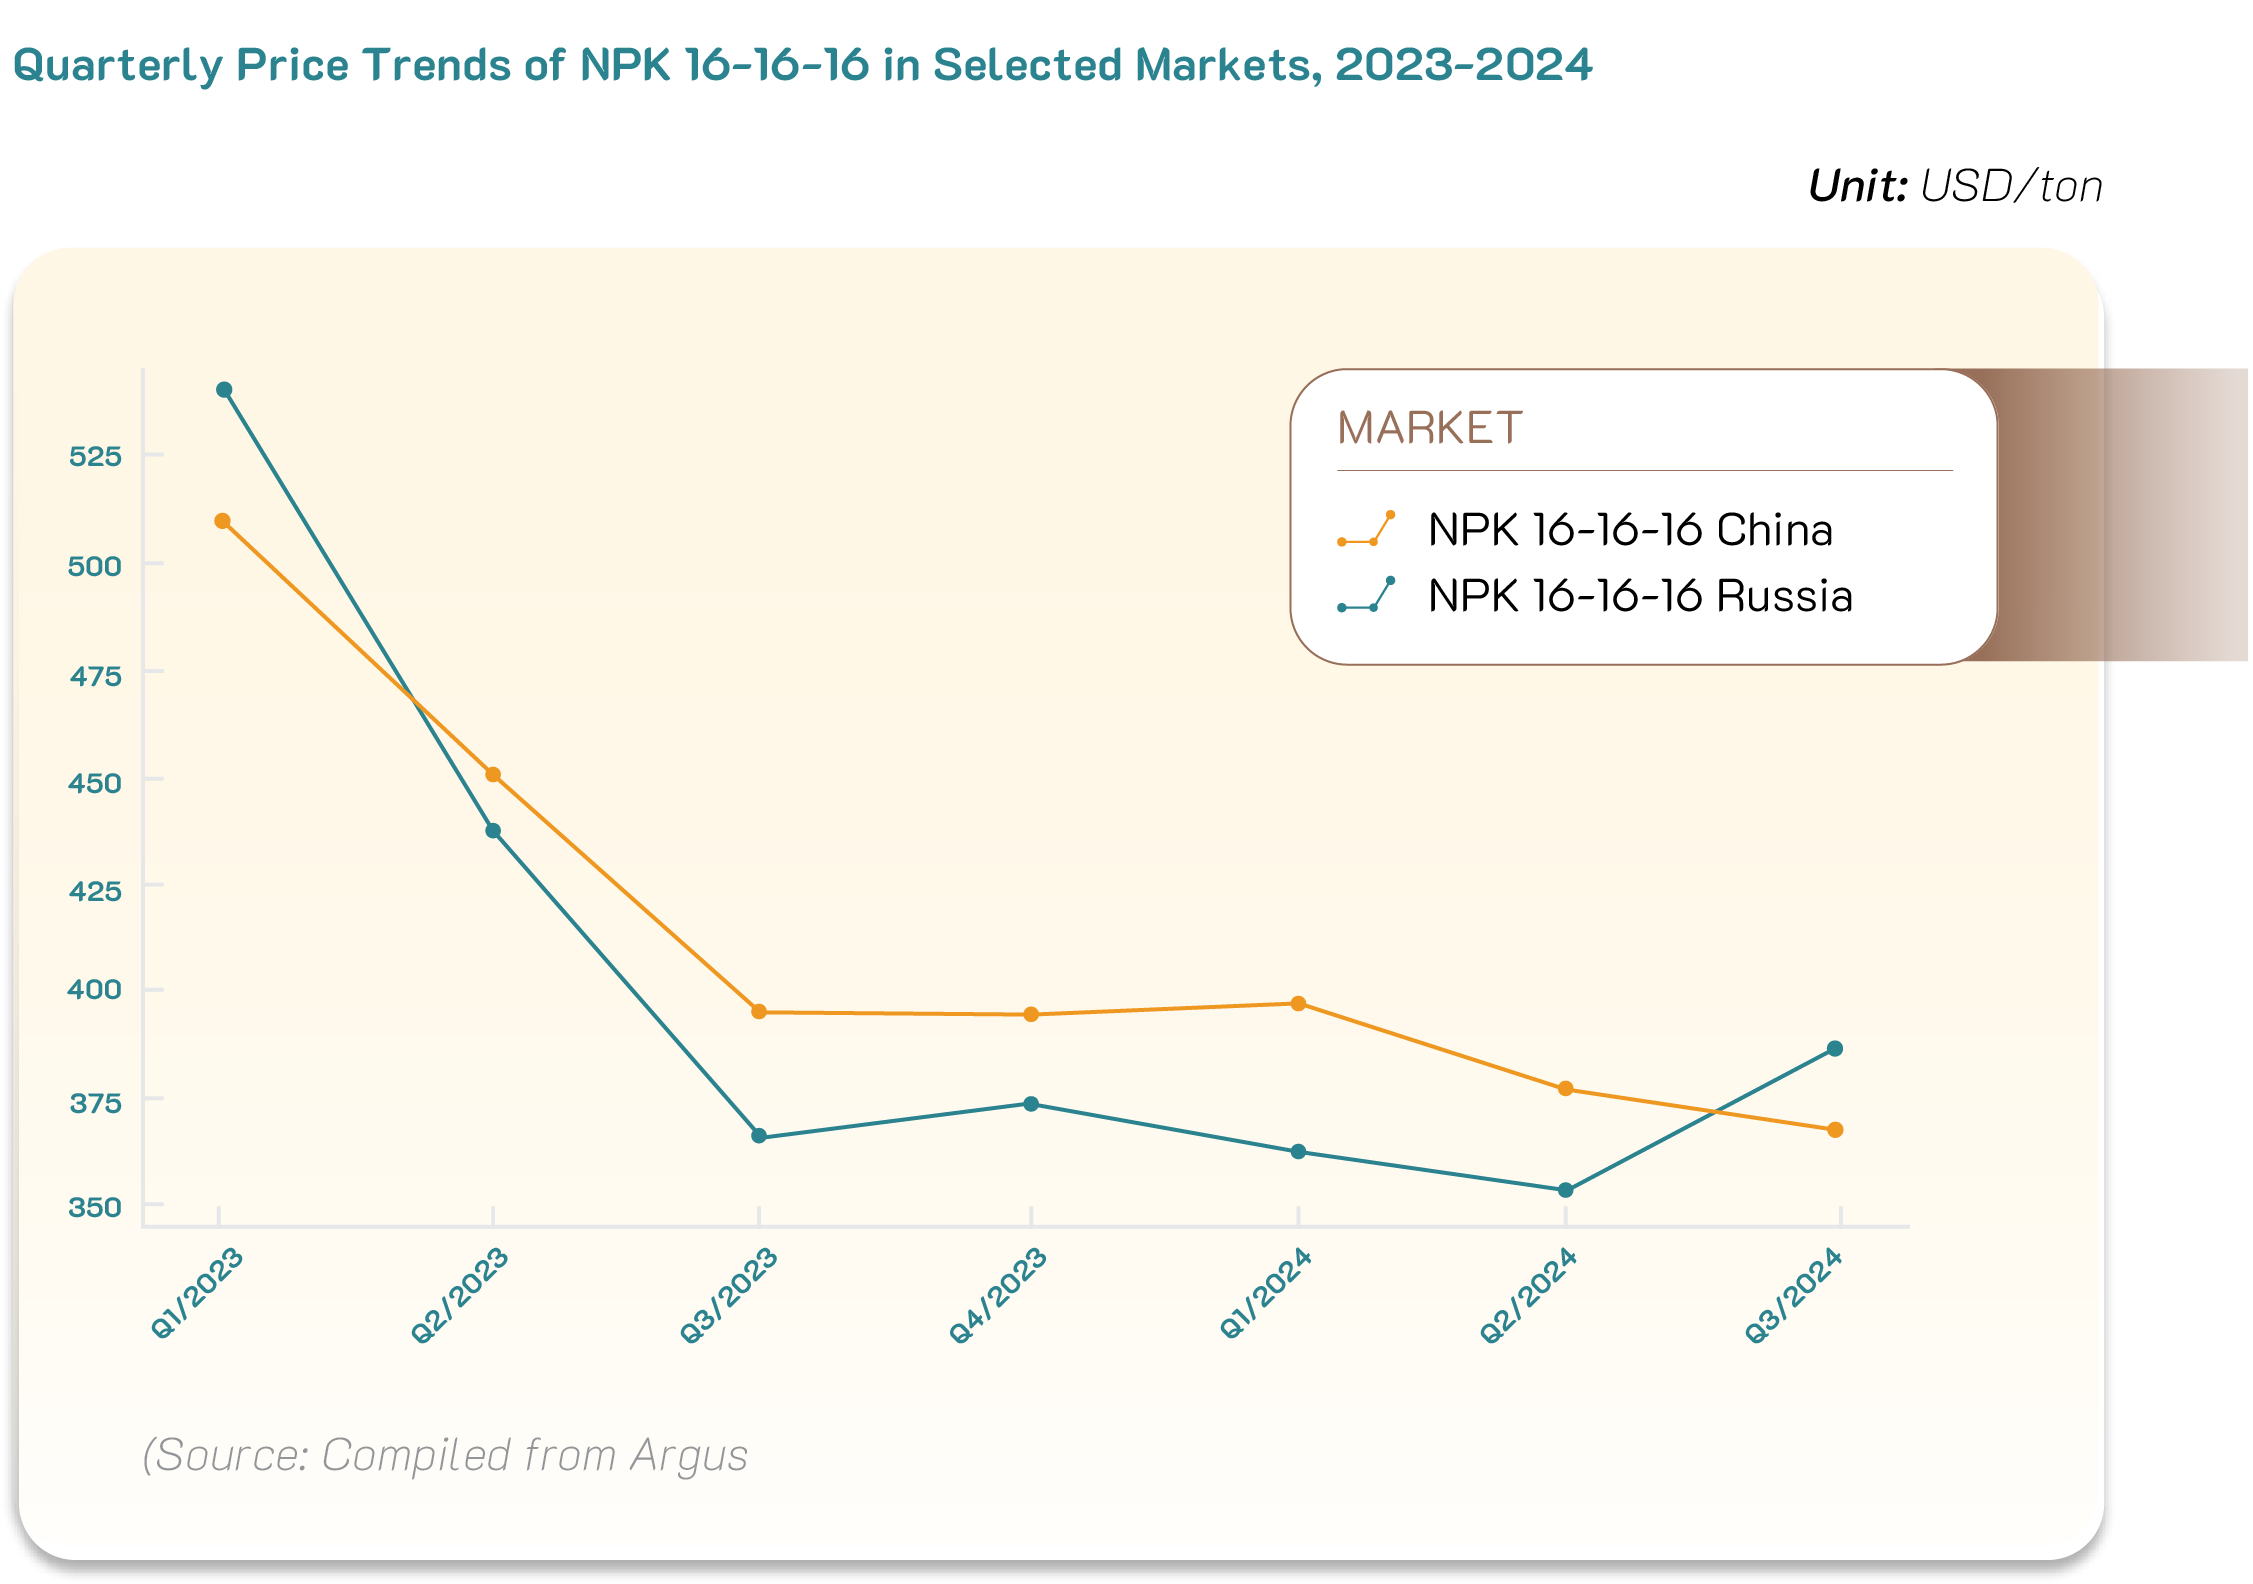
Pricing: Since NPK market includes various formulations and depends on specific demand characteristics, NPK prices vary across producers and key importing markets. For the 16-16-16 NPK formulation, based on observations from Russian and Chinese exporters over the past two years, NPK prices have generally declined. Prices fell sharply and continuously from Q1/2023 to Q3/2023, then stabilized in Q4/2023. In 2024, NPK prices showed signs of a slight decline, hitting the bottom in Q2/2024, followed by a gradual recovery in Q3/2024. NPK price movements are heavily influenced by global urea, potassium, and DAP prices.
DOMESTIC SUPPLY AND DEMAND
| No. | Products | Domestic Demand | Estimated Supply | Supply-Demand Balance | ||
|---|---|---|---|---|---|---|
| Year 2024 | Forecast 2025 | Domestic | Import | |||
| 1 | Urea | 2,100 - 2,200 | 2,200 - 2,300 | 2,400 - 2,600 | 250 - 300 | Meet domestic and export needs |
| 2 | DAP | 700 - 800 | 800 - 900 | 500 - 600 | 300 - 400 | Shortfall covered by exports |
| 3 | Potassium | 900 - 1,000 | 1,000 - 1,200 | 0 | 1,000 - 1,200 | 100% imported |
| 4 | NPK | 3,200 - 4,000 | 3,500 - 4,200 | 3,600 - 5,000 | 350 - 450 | Surplus but high-grade NPK import |
| 5 | SA | 1,100 - 1,200 | 1,100 - 1,200 | 0 | 1,200 - 1,300 | 100% imported |
| 6 | Phosphate | 1,800 - 1,900 | 1,800 - 1,900 | 1,500 - 2,000 | - | Meet domestic demand |
| 7 | Organic Fertilizer | 2,000 - 2,500 | 2,200 - 2,600 | 2,900 - 3,000 | 400 - 500 | Domestic supply
meets demand,
but high-quality imports are still needed |
KEY INFLUENCING FACTORS
The agricultural sector plays a crucial role in Vietnam’s economy, accounting for approximately 10% of GDP and employing around 40% of the workforce. Therefore, agricultural development directly impacts the fertilizer demand. In other words, when agricultural production grows, the demand for fertilizers increases to enhance crop productivity. This creates opportunities for fertilizer manufacturers to boost production and expand their market presence.
The agriculture sector is currently transitioning towards green, sustainable, and environmentally friendly development to meet stricter consumer market requirements. This shift also requires fertilizer manufacturers to renovate their production and products to meet the growing demand for organic and eco-friendly fertilizers.